This article is more than one year old. Older articles may contain outdated content. Check that the information in the page has not become incorrect since its publication.
Sentinel Safeguarding Dubbo Services
In complex production environments, thousands of Dubbo service instances may be deployed, with continuous traffic flowing in and services calling each other. However, distributed systems may encounter issues like traffic surges, system overload, and network delays, leading to service unavailability. If not controlled, this may cause cascading failures, impacting service availability. Hence, the rational control of traffic becomes key to ensuring service stability.
Sentinel is an open-source lightweight traffic control product developed by Alibaba’s middleware team, focusing on traffic dynamics and helping users protect service stability through traffic control, circuit breaking, and system load protection. This article will explore how Sentinel performs traffic control based on Dubbo, providing best practices for Dubbo integration with Sentinel.
Quick Access to Sentinel
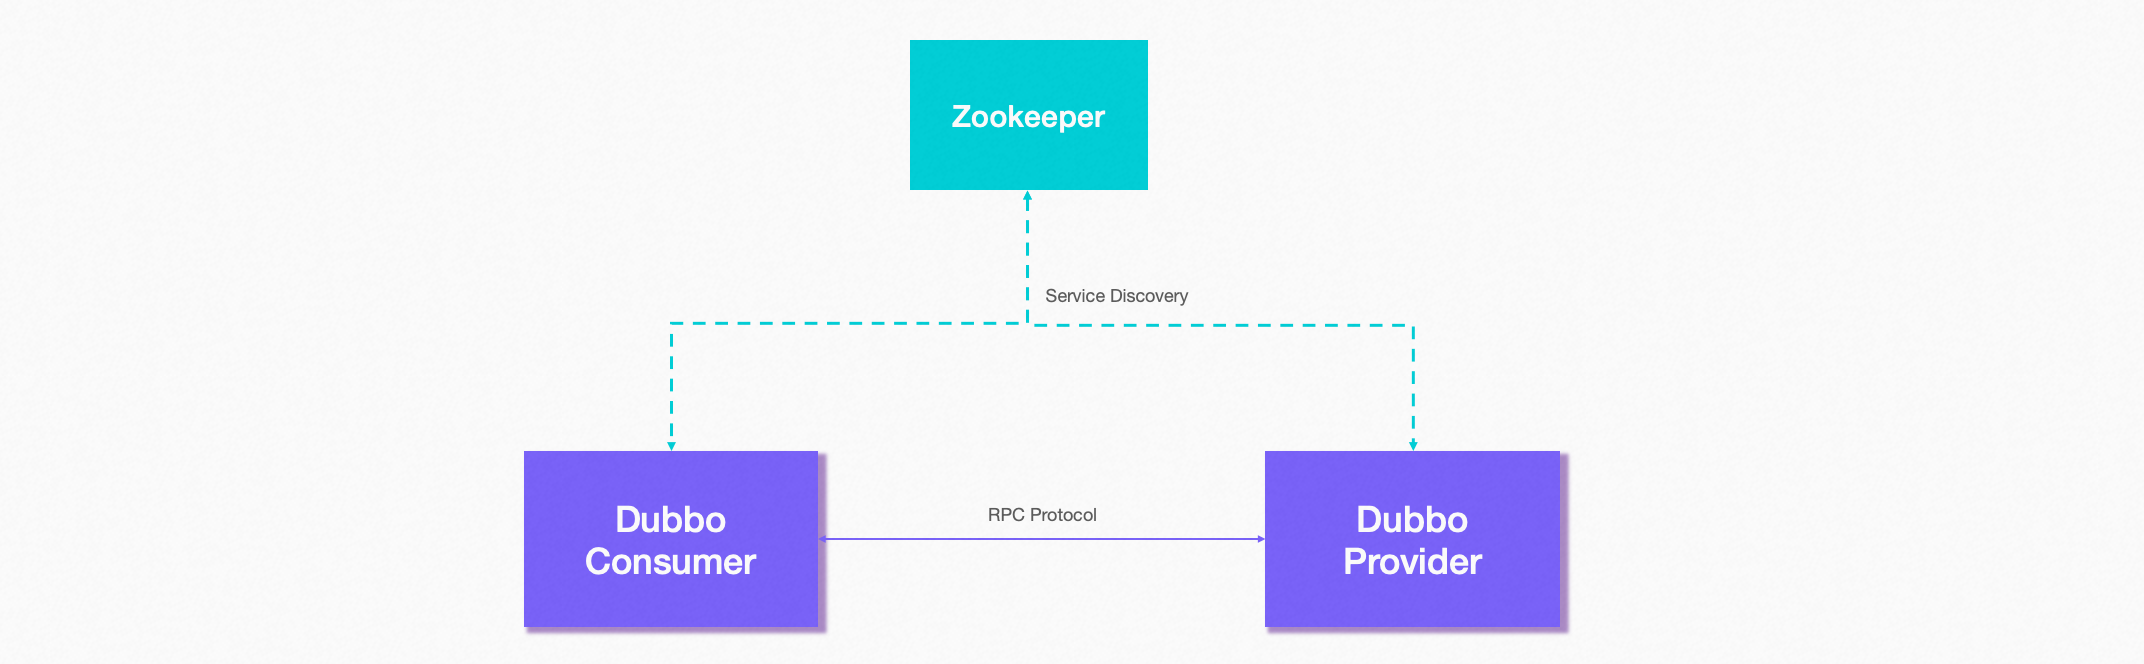
Sentinel means sentinel, symbolically illustrating its role and importance in distributed systems. In Dubbo’s ecosystem, core modules include the registry, service providers, service consumers, and monitoring. Sentinel enhances service availability by rate limiting service providers and consumers. Let’s explore the technical approach of Sentinel’s rate limiting for service providers and consumers.
Sentinel provides a Dubbo-adapted module – Sentinel Dubbo Adapter, which includes filters for service providers and consumers. To use it, simply add the following module (using Maven as an example):
<dependency>
    <groupId>com.alibaba.csp</groupId>
    <artifactId>sentinel-dubbo-adapter</artifactId>
    <version>x.y.z</version>
</dependency>
After introducing this dependency, the service interfaces and methods (both calling and serving sides) become resources in Sentinel. After configuring rules, services can automatically benefit from Sentinel’s protections. Flexible configuration options are provided; for example, one can manually disable a specific filter in the Sentinel Dubbo Adapter if desired.
After connecting to the Sentinel Dubbo Adapter, even without configured rules, Sentinel will statistically aggregate the invocation information of the corresponding Dubbo service. So how can we verify a successful connection? This is where a powerful tool – the Sentinel dashboard – comes into play.
Essential for Rate Limiting - Monitoring and Management
Traffic is highly real-time, and rate limiting is necessary because we cannot precisely predict traffic bursts. Otherwise, we could simply handle it with elastic computing resources. Therefore, to ensure accuracy in rate limiting, the monitoring capabilities of the rate limiting framework are vital.
The Sentinel dashboard is the entrance for unified configuration and management of traffic control, circuit breaking, and degradation rules, while offering multiple monitoring dimensions. On the Sentinel dashboard, users can configure rules and view traffic control effects in real time.
Steps to access the Sentinel dashboard are as follows (all are necessary):
- Start the dashboard according to the Sentinel Dashboard Documentation.
- Include the
sentinel-transport-simple-httpdependency in the application, so the dashboard can pull relevant application information. - Add relevant startup parameters to the application. Required parameters include:
-Dcsp.sentinel.api.port: Client port to report relevant information (default is 8719).-Dcsp.sentinel.dashboard.server: Address of the dashboard.-Dproject.name: Application name, displayed on the dashboard.
Note that in some environments, running Dubbo services locally also requires adding the -Djava.net.preferIPv4Stack=true parameter. For example, the startup parameters for the Service Provider can be:
-Djava.net.preferIPv4Stack=true -Dcsp.sentinel.api.port=8720 -Dcsp.sentinel.dashboard.server=localhost:8080 -Dproject.name=dubbo-provider-demo
This way, after starting the application, you will find the corresponding application on the dashboard. Here are common features:
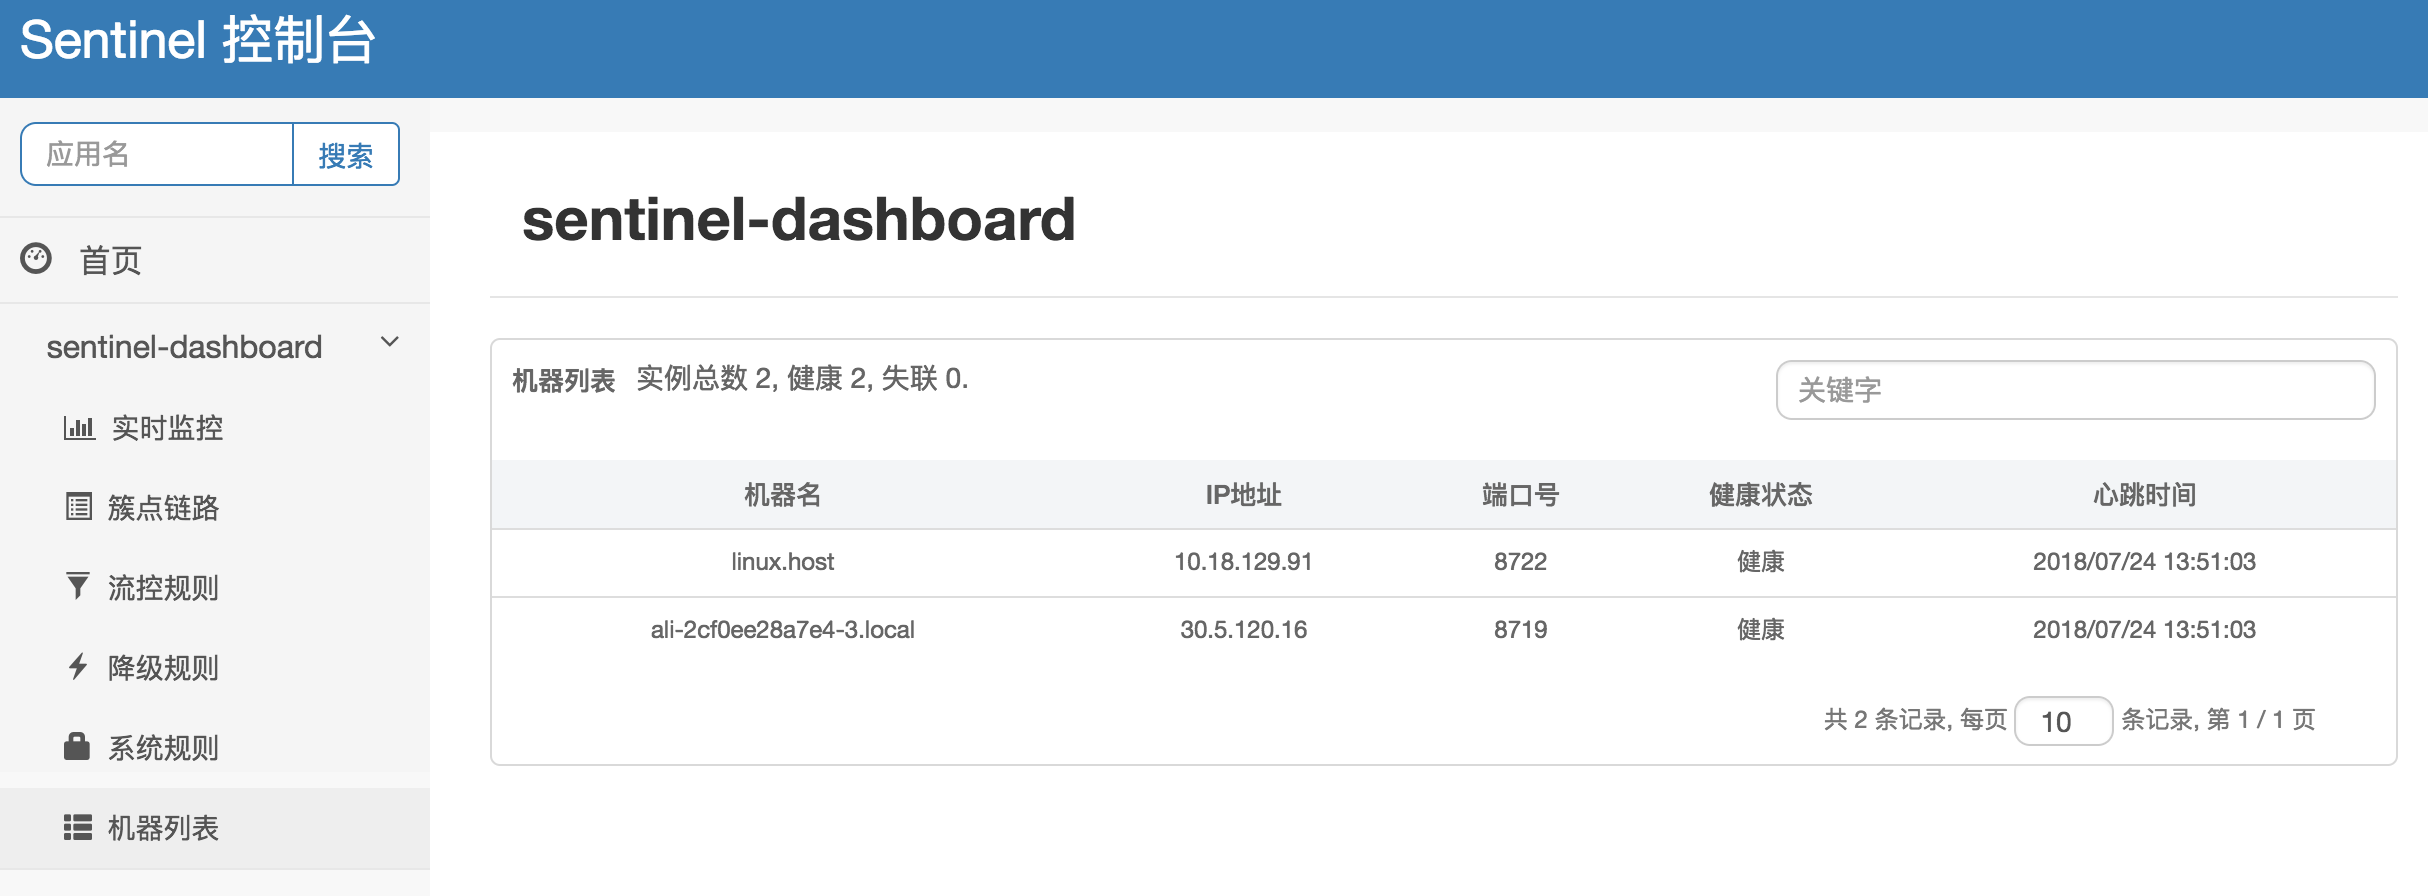
- Device Monitoring: When your machine appears in the machine list, it indicates successful connection to the dashboard, allowing you to view device name, IP address, port number, health status, and heartbeat time.
- Link Monitoring: This feature pulls the operating conditions of designated client resources in real-time, offering two display modes: one shows the resource call chain in a tree structure; the other displays resource performance without distinguishing the call chain. Through link monitoring, you can check the historical status of flow control and downgrading for each resource.
| Tree Link | Flat Link |
|---|---|
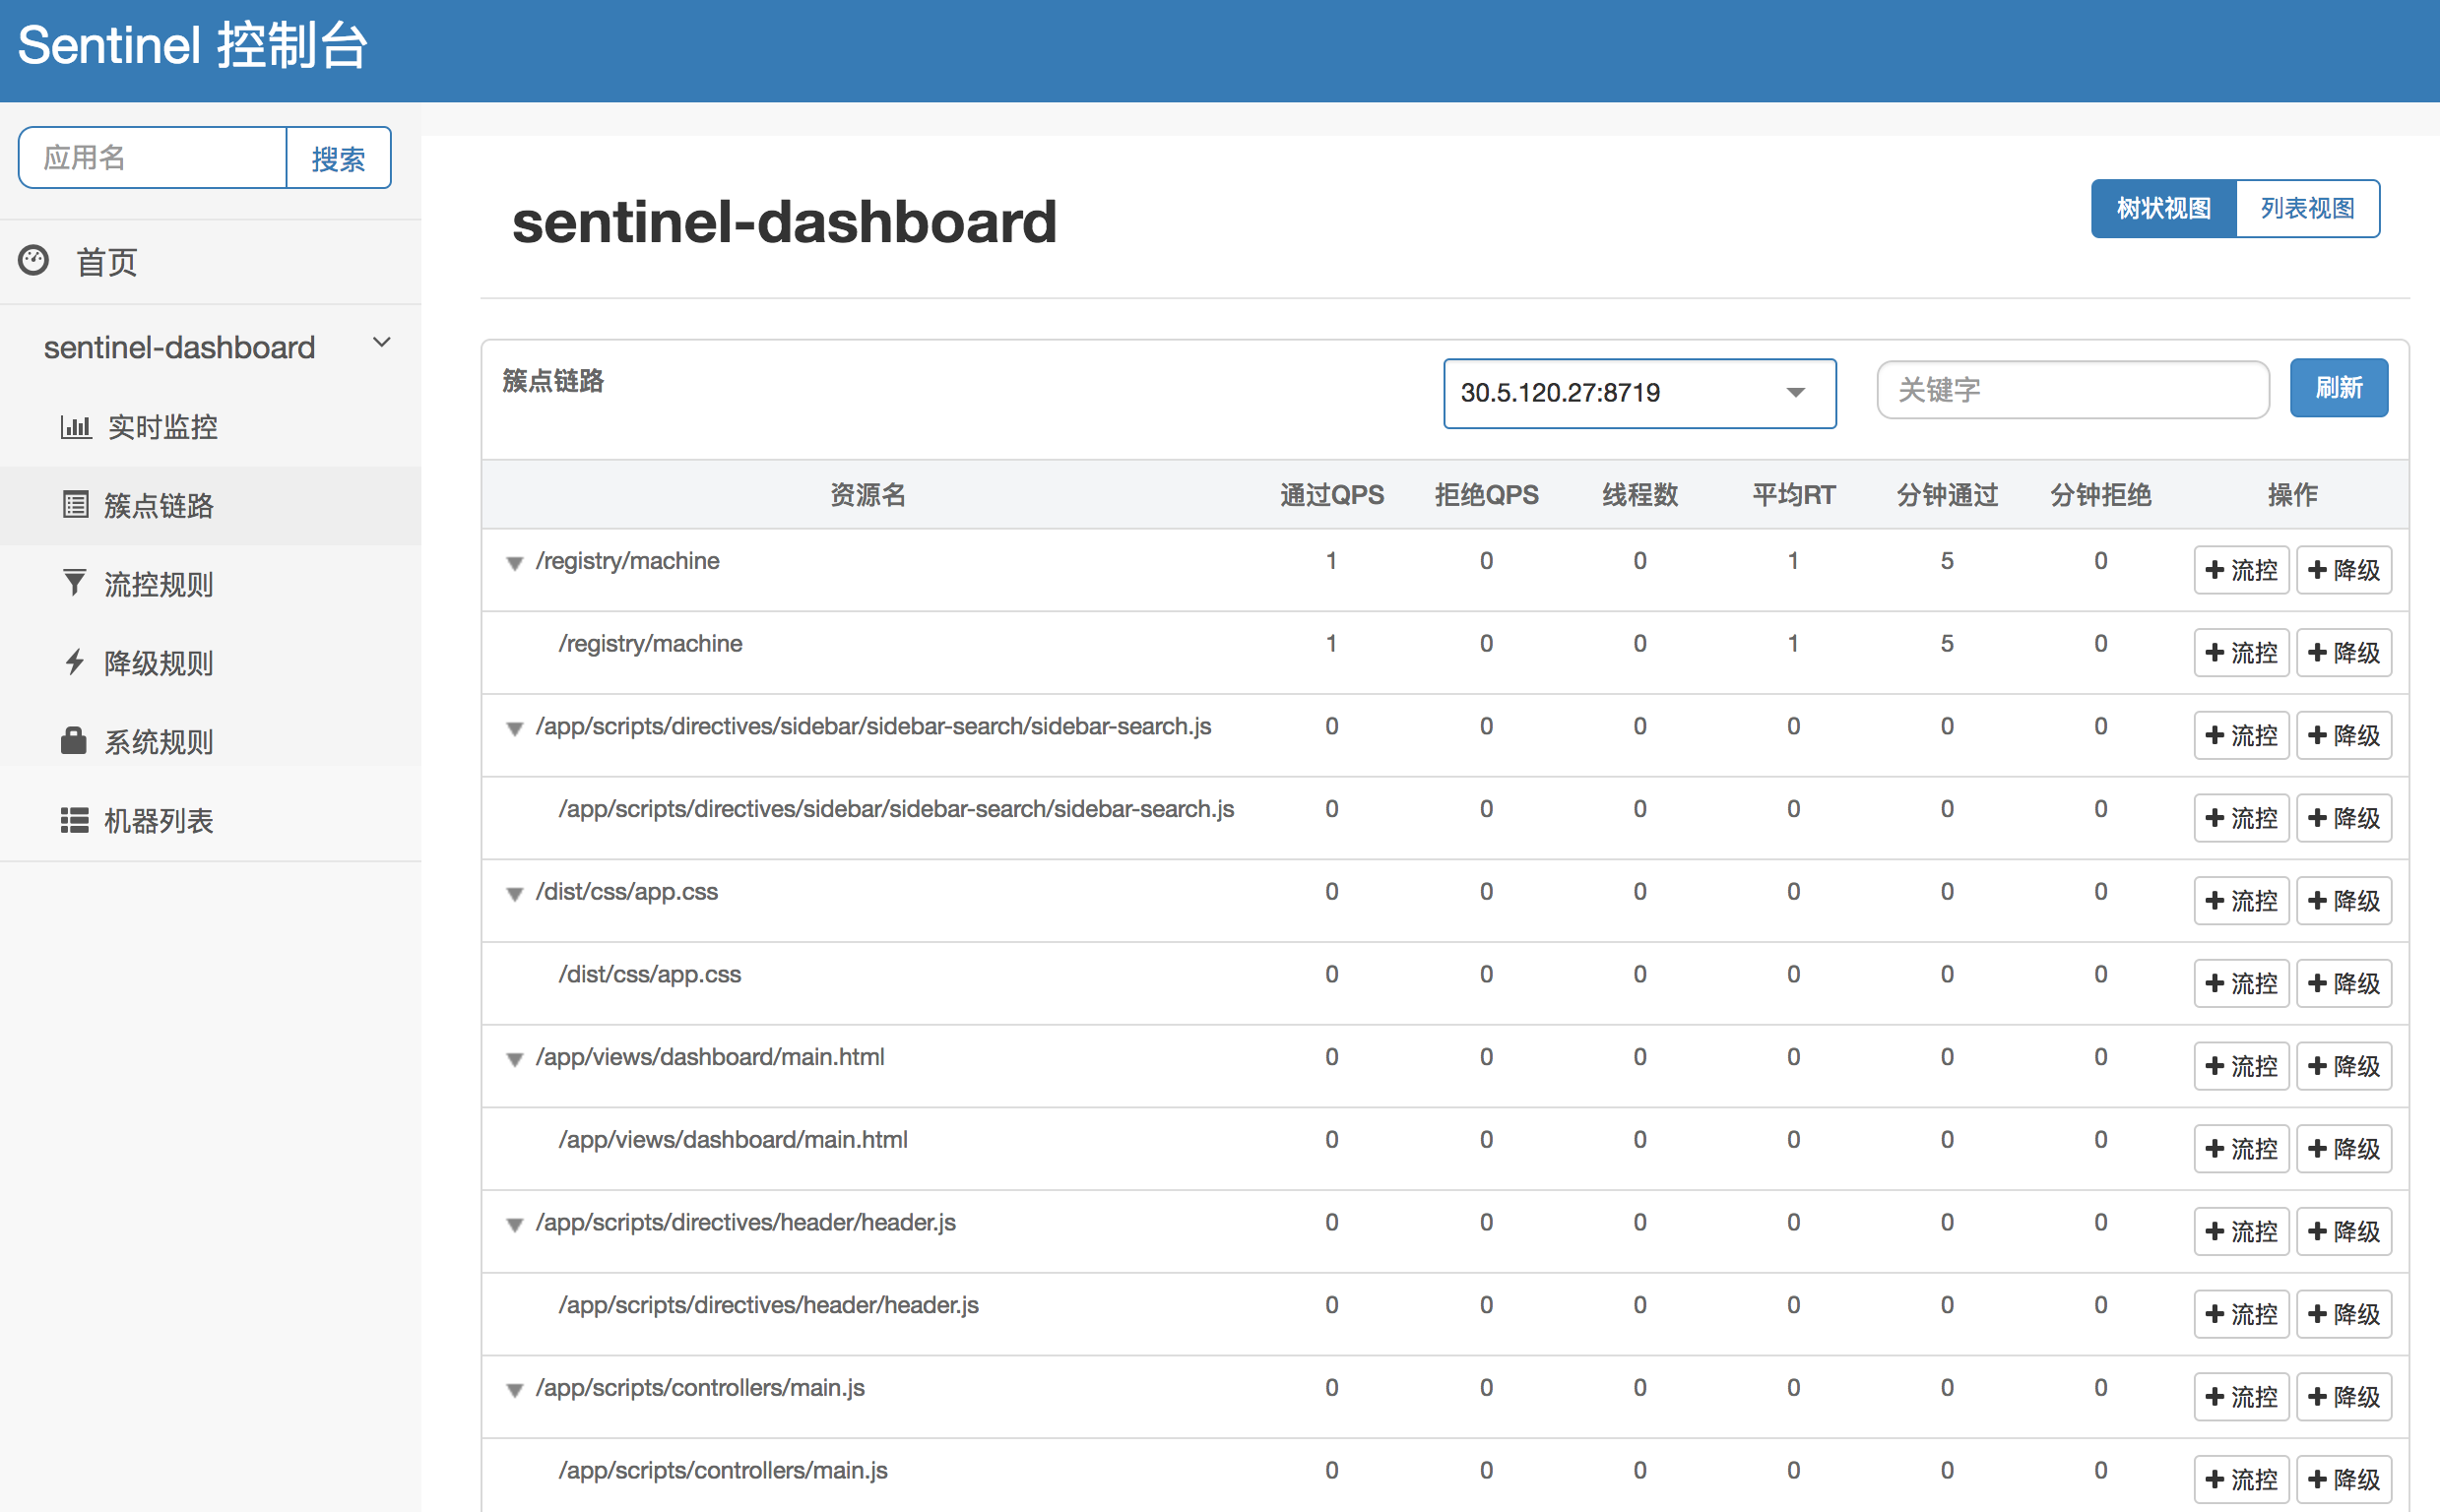 |  |
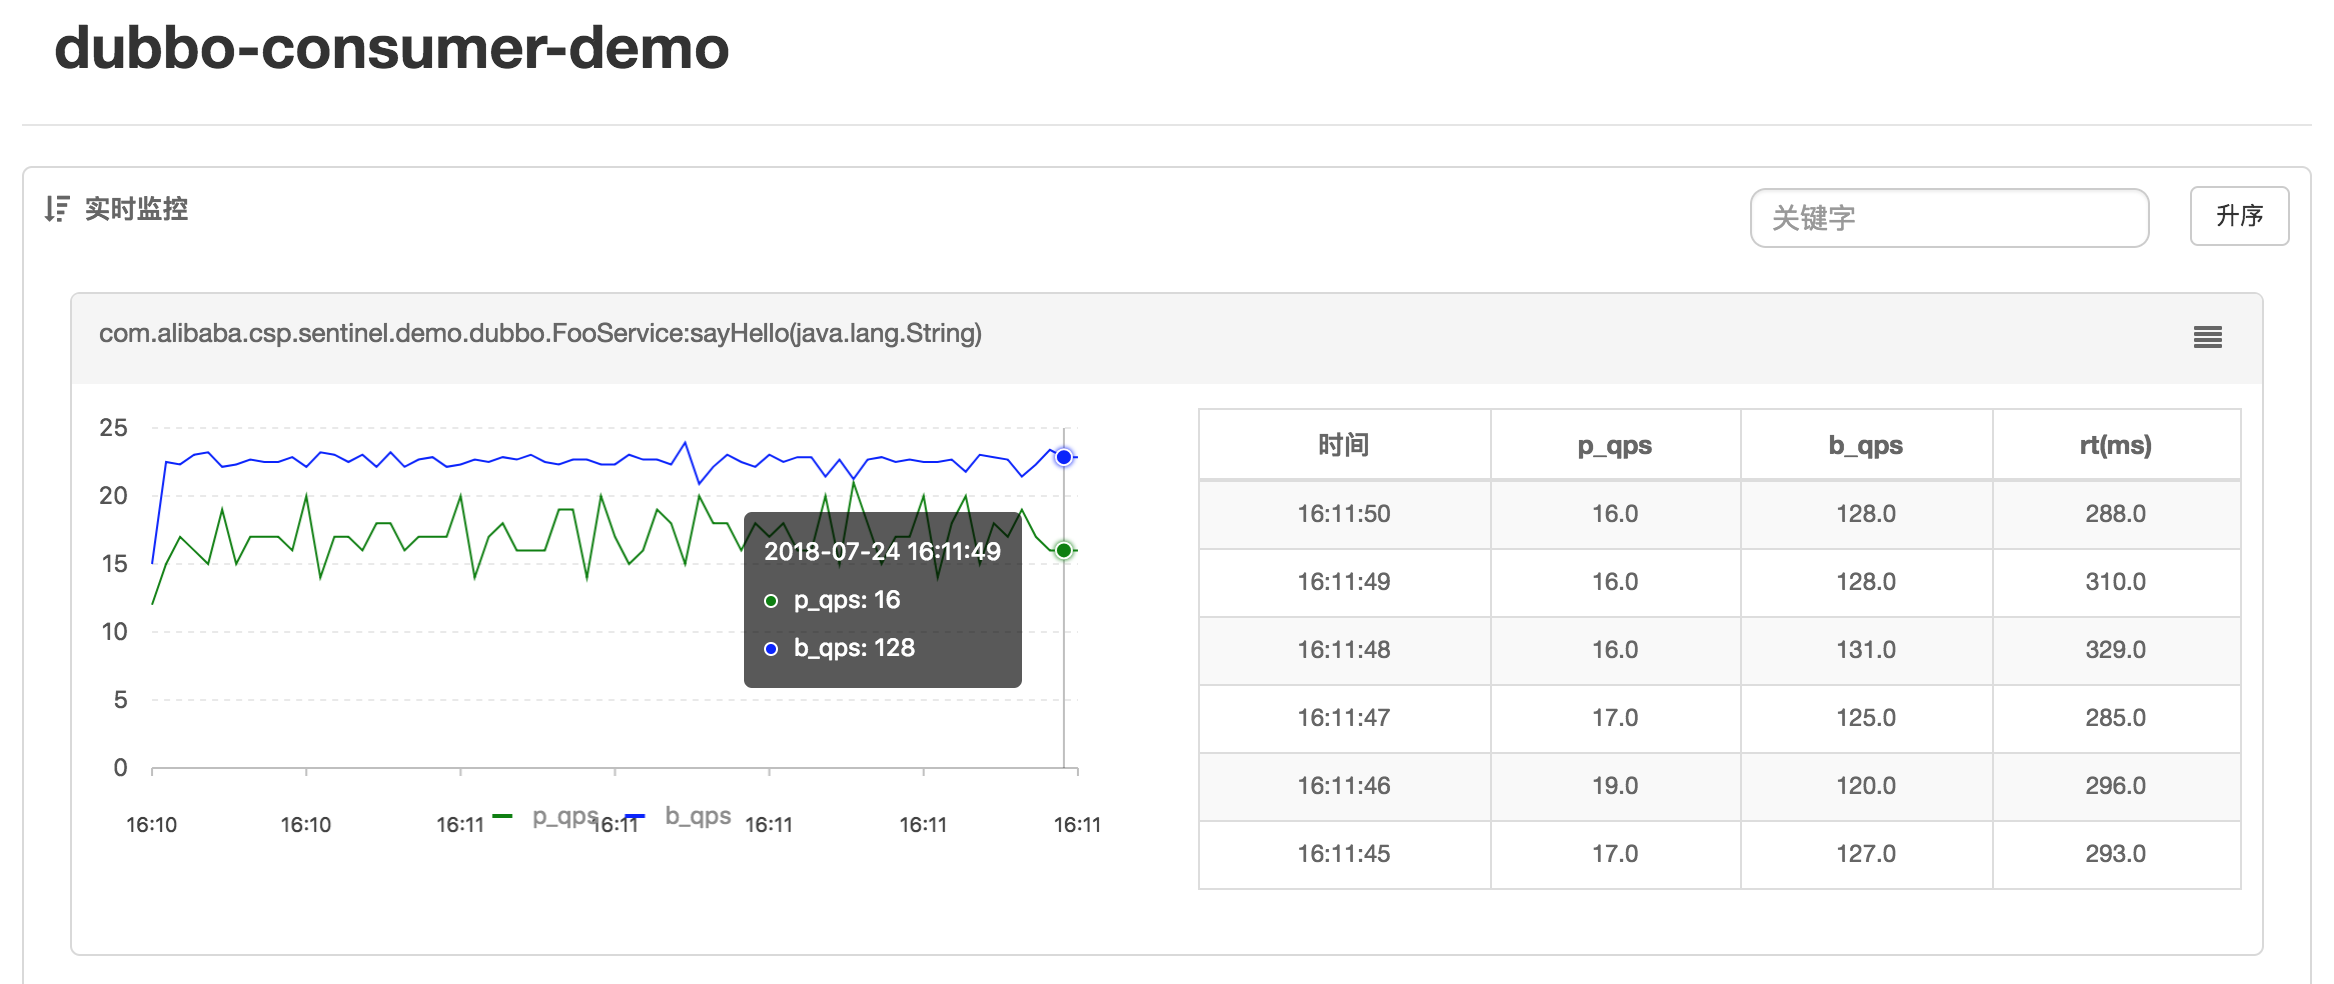
- Aggregate Monitoring: Information from all devices under the same service is aggregated for real-time monitoring, achieving accuracy to the second level.
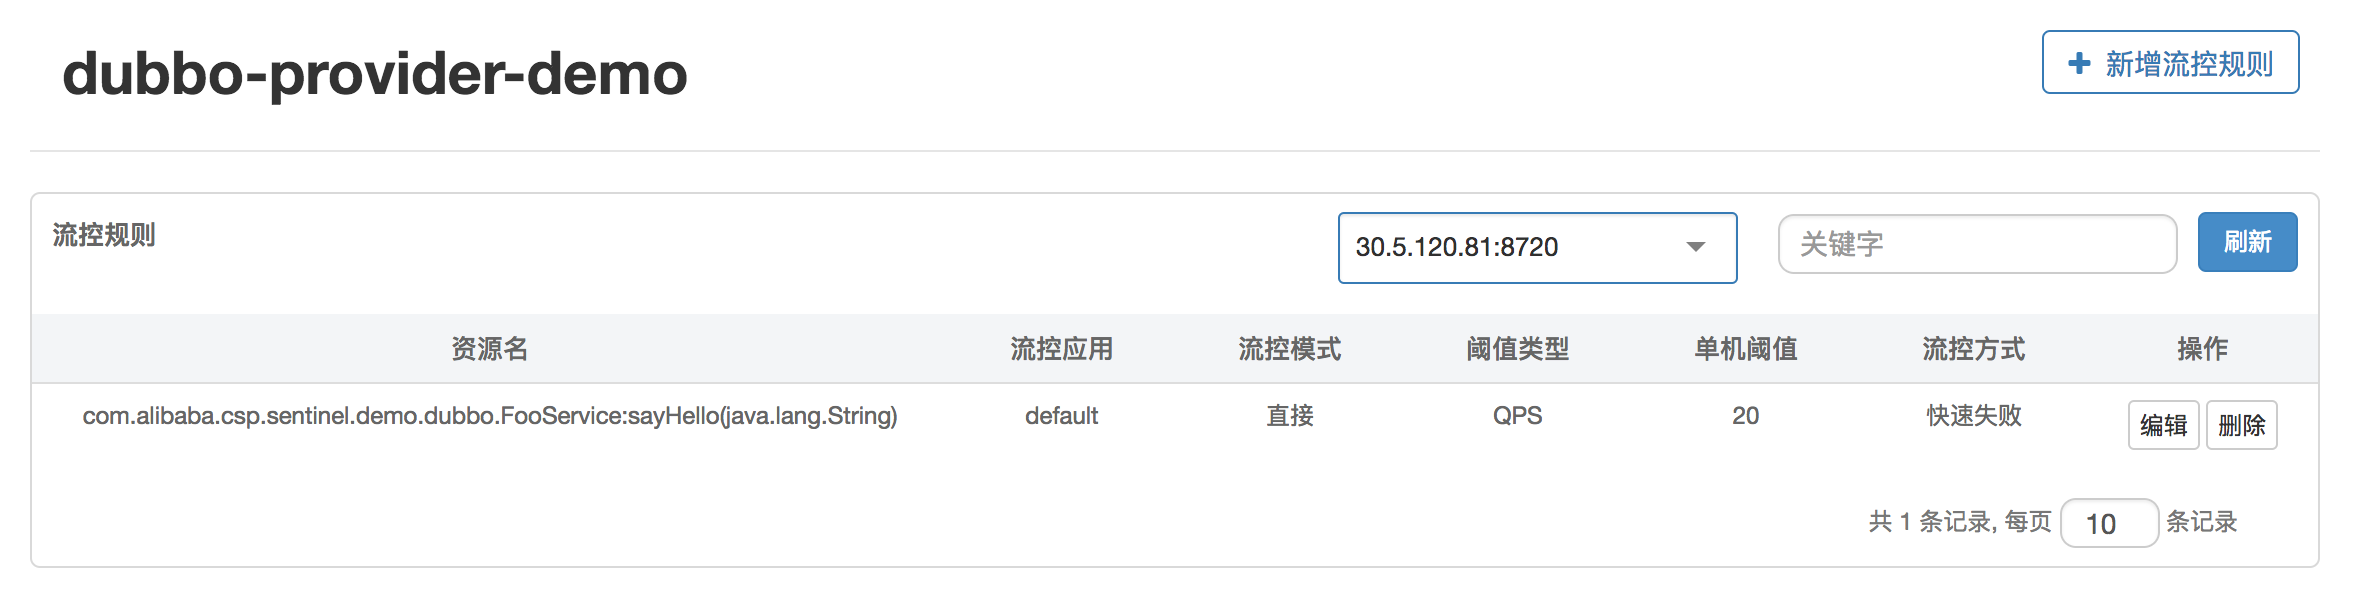
- Rule Configuration: You can view existing flow, degradation, and system protection rules and configure them in real time.
Best Practices of Sentinel Based on Dubbo
For specific demo code, please refer to sentinel-demo-dubbo.
Service Provider
Traffic control for service providers can be divided into two dimensions: self-protection capabilities of service providers and request allocation capabilities to service consumers.
Service Providers offer services externally, handling various consumer requests. To protect the Provider from being overwhelmed by surge traffic, you can configure a QPS mode rate limit. This way, when the request volume exceeds the set threshold per second, excessive requests are automatically rejected. The rate limit granularity can be either at the service interface level or service method level. If you want the overall QPS of a service interface not to exceed a certain value, you can configure the QPS threshold for the corresponding service interface resource (resourceName is the fully qualified name of the interface); if you want the QPS of a specific method to remain below a certain number, you can set the QPS threshold for the corresponding method resource (resourceName is the fully qualified name of the interface: method signature). For details, refer to Traffic Control | Sentinel.
Let’s look at the effect of rate limiting in this mode. Suppose we defined a service interface com.alibaba.csp.sentinel.demo.dubbo.FooService, with a method sayHello(java.lang.String), and set the QPS threshold for this method to 10 on the Provider side. If the Consumer side issues 15 calls within 1 second, you can see through the log file that the Provider has been rate limited. Intercept logs are recorded uniformly at ~/logs/csp/sentinel-block.log:
2018-07-24 17:13:43|1|com.alibaba.csp.sentinel.demo.dubbo.FooService:sayHello(java.lang.String),FlowException,default,|5,0
The corresponding metrics logs on the Provider side also contain records:
1532423623000|2018-07-24 17:13:43|com.alibaba.csp.sentinel.demo.dubbo.FooService|15|0|15|0|3
1532423623000|2018-07-24 17:13:43|com.alibaba.csp.sentinel.demo.dubbo.FooService:sayHello(java.lang.String)|10|5|10|0|0
Allocating processing capabilities of service providers based on caller demands is also a common rate limiting method. For example, if services A and B both call the Service Provider and we want to rate limit only requests from service B, we can set the rate limiting rule’s limitApp to the name of service B. The Sentinel Dubbo Adapter automatically parses the Dubbo consumer’s (caller) application name as the caller’s name (origin), and when protecting resources, the caller’s name will also be included. If rate limiting rules do not specify the caller (default), then the rules apply to all callers. If defined for a specific caller, the rules will apply solely to that designated caller.
Note: Dubbo’s default communication does not carry the remote application name information, so developers need to manually place the application name into the attachment on the calling side, and the provider side will parse it accordingly. The Sentinel Dubbo Adapter implements a filter to automatically pass the application name from the consumer side to the provider side. If the calling side does not introduce the Sentinel Dubbo Adapter and still wishes to rate limit based on the caller, the application name can be manually placed into the attachment, with the key being
dubboApplication.
The caller’s name will also be recorded in the rate limiting logs, such as in the following log where demo-consumer is the caller’s name:
2018-07-25 16:26:48|1|com.alibaba.csp.sentinel.demo.dubbo.FooService:sayHello(java.lang.String),FlowException,default,demo-consumer|5,0
Service Consumer
Traffic control for service providers can differ as controlling concurrency thread count and service degradation.
Concurrency Thread Count Rate Limiting
Service Consumers call remote services as clients. Each service may depend on several downstream services; if a downstream service B that service A depends on becomes unstable, the response time of service B lengthens, causing a backlog of service A’s calls to it. By controlling the concurrency thread count for accessing downstream service B, we ensure that service A is not overwhelmed during the instability of service B. In such scenarios, it is recommended that the Consumer configure thread count mode for rate limiting to shield itself from unreliable services. Once thread count-based rate limiting is enabled, there’s no need for explicit thread pool isolation; Sentinel will manage the thread count for the resource, rejecting requests that exceed it until the accumulated threads are processed efficiently.
Let’s observe the effect of this mode. Suppose service A relies on two remote service methods sayHello(java.lang.String) and doAnother(). The former has a response time of 1s-1.5s, while the latter’s RT is minimal (around 30 ms). Service A sets the thread count for both remote methods to 5. Every 50 ms, two tasks are submitted to the thread pool, both consumers invoking the respective methods continuously 10 times. You will see that the sayHello method is rate limited 5 times, as previous invocations haven’t returned due to the higher RT; meanwhile, the doAnother() calls are unaffected. Quick failure when exceeding thread count effectively prevents self-impacts from slow calls.
Service Degradation
When a service depends on multiple downstream services, a sluggish downstream call can severely affect the current service’s operations. Here, we can utilize Sentinel’s circuit breaking and degradation feature, configuring degradation rules based on average RT for the calling side. If any service in the calling chain has an elevated average RT above the configured threshold a certain number of times, Sentinel will downgrade that calling resource, immediately rejecting subsequent calls until a preset time elapses, thus protecting the service from the downstream bottleneck. The fallback feature can also be utilized for providing appropriate handling logic during downgrades.
Fallback
Starting from version 0.1.1, the Sentinel Dubbo Adapter also supports configuring a global fallback function to handle fallback operations when Dubbo services are rate limited/degraded/load protected. Users simply need to implement a custom DubboFallback interface and register it through DubboFallbackRegistry. By default, the BlockException will be wrapped and thrown. At the same time, this can be combined with Dubbo’s fallback mechanism to provide alternative implementations for downgraded services.
Comparison Between Sentinel and Hystrix
The commonly used circuit breaker/degradation/isolation library in the industry is Netflix’s Hystrix. So what are the similarities and differences between Sentinel and Hystrix? Hystrix primarily focuses on a fault tolerance mechanism based on isolation and circuit breaking, whereas Sentinel emphasizes diverse traffic control, circuit breaking, degradation, system load protection, real-time monitoring, and dashboard capabilities, addressing distinctly different problems.
Hystrix employs the command pattern to encapsulate resource calling logic, strongly tying resource definitions and isolation rules together, meaning one must specify an isolation rule when creating a HystrixCommand (as its execution model relies on isolation patterns). Sentinel’s design is simpler; it doesn’t concern how resources are executed, separating resource definitions from rule configurations. Users can define resources first and configure rules when needed. Sentinel’s principle is straightforward: execute respective rate limiting/degradation/load protection strategies based on configured rules for corresponding resources; if rules are not configured, only statistics are gathered. Starting from version 0.1.1, Sentinel also introduced annotation support, making resource definition more convenient.
Isolation is a core feature of Hystrix. Hystrix achieves isolation of dependencies (corresponding resources in Sentinel) via thread pools or signals, with resource isolation being the most commonly used. The advantage of Hystrix thread pool isolation is thoroughness, yet the drawback is the need to create many thread pools, leading to substantial context switch overhead when the application itself has a high thread count; Hystrix’s signal-based isolation limits concurrent calls without explicitly creating threads, making it lightweight but incapable of automatically degrading slow calls, thus potentially causing cascading blocking. Sentinel offers signal isolation features through concurrency thread count rate control and combines it with response time-based circuit breaking/degradation modes to automatically degrade when the average response time of unstable resources is high, preventing excessive slow calls from saturating the concurrency count and affecting the entire system.
Hystrix’s circuit breaking functionality adopts a circuit breaker pattern, automatically tripping when failure rates for a service are high. Sentinel’s circuit breaking and degradation capabilities are more generic, supporting both average response time and failure rates as metrics. Sentinel also provides support for various call chain relationships and effects of traffic control, while dynamically adjusting traffic based on system load to protect the system, offering more abundant application scenarios. Furthermore, Sentinel offers real-time monitoring APIs and a dashboard for users to quickly understand the system’s status, grasping service stability.
For a more detailed comparison, please refer to Comparison Between Sentinel and Hystrix.
Summary
The above introduction only covers one of Sentinel’s simplest scenarios – rate limiting. Sentinel can handle more complex situations, such as timeout circuit breaking, cold starts, and request smoothing. Please consult the Sentinel Documentation for more scenarios waiting for you to explore!