This article is more than one year old. Older articles may contain outdated content. Check that the information in the page has not become incorrect since its publication.
Tracing Dubbo With OpenTelemetry
Overview
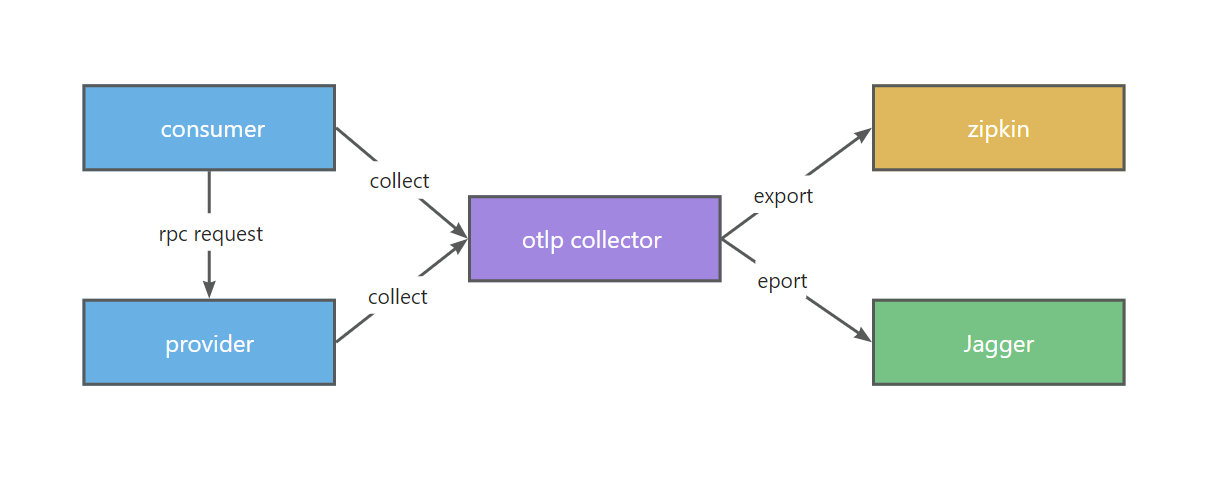
This case shows using OpenTelemetry(otlp) as the Tracer in the Dubbo project to report the Trace information to the Otlp Collector, which then forwards it to Zipkin and Jagger. Code address
It consists of three parts:
- dubbo-samples-spring-boot-tracing-otel-oltp-interface
- dubbo-samples-spring-boot-tracing-otel-oltp-provider
- dubbo-samples-spring-boot-tracing-otel-oltp-consumer
Architecture
Quick Start
Install & start Otlp Collector
Follow OpenTelemetry Collector Quick Start to start the otlp collector.
Start Provider
Run org.apache.dubbo.springboot.demo.provider.ProviderApplication directly from IDE.
Start Consumer
Start org.apache.dubbo.springboot.demo.consumer.ConsumerApplication directly from IDE.
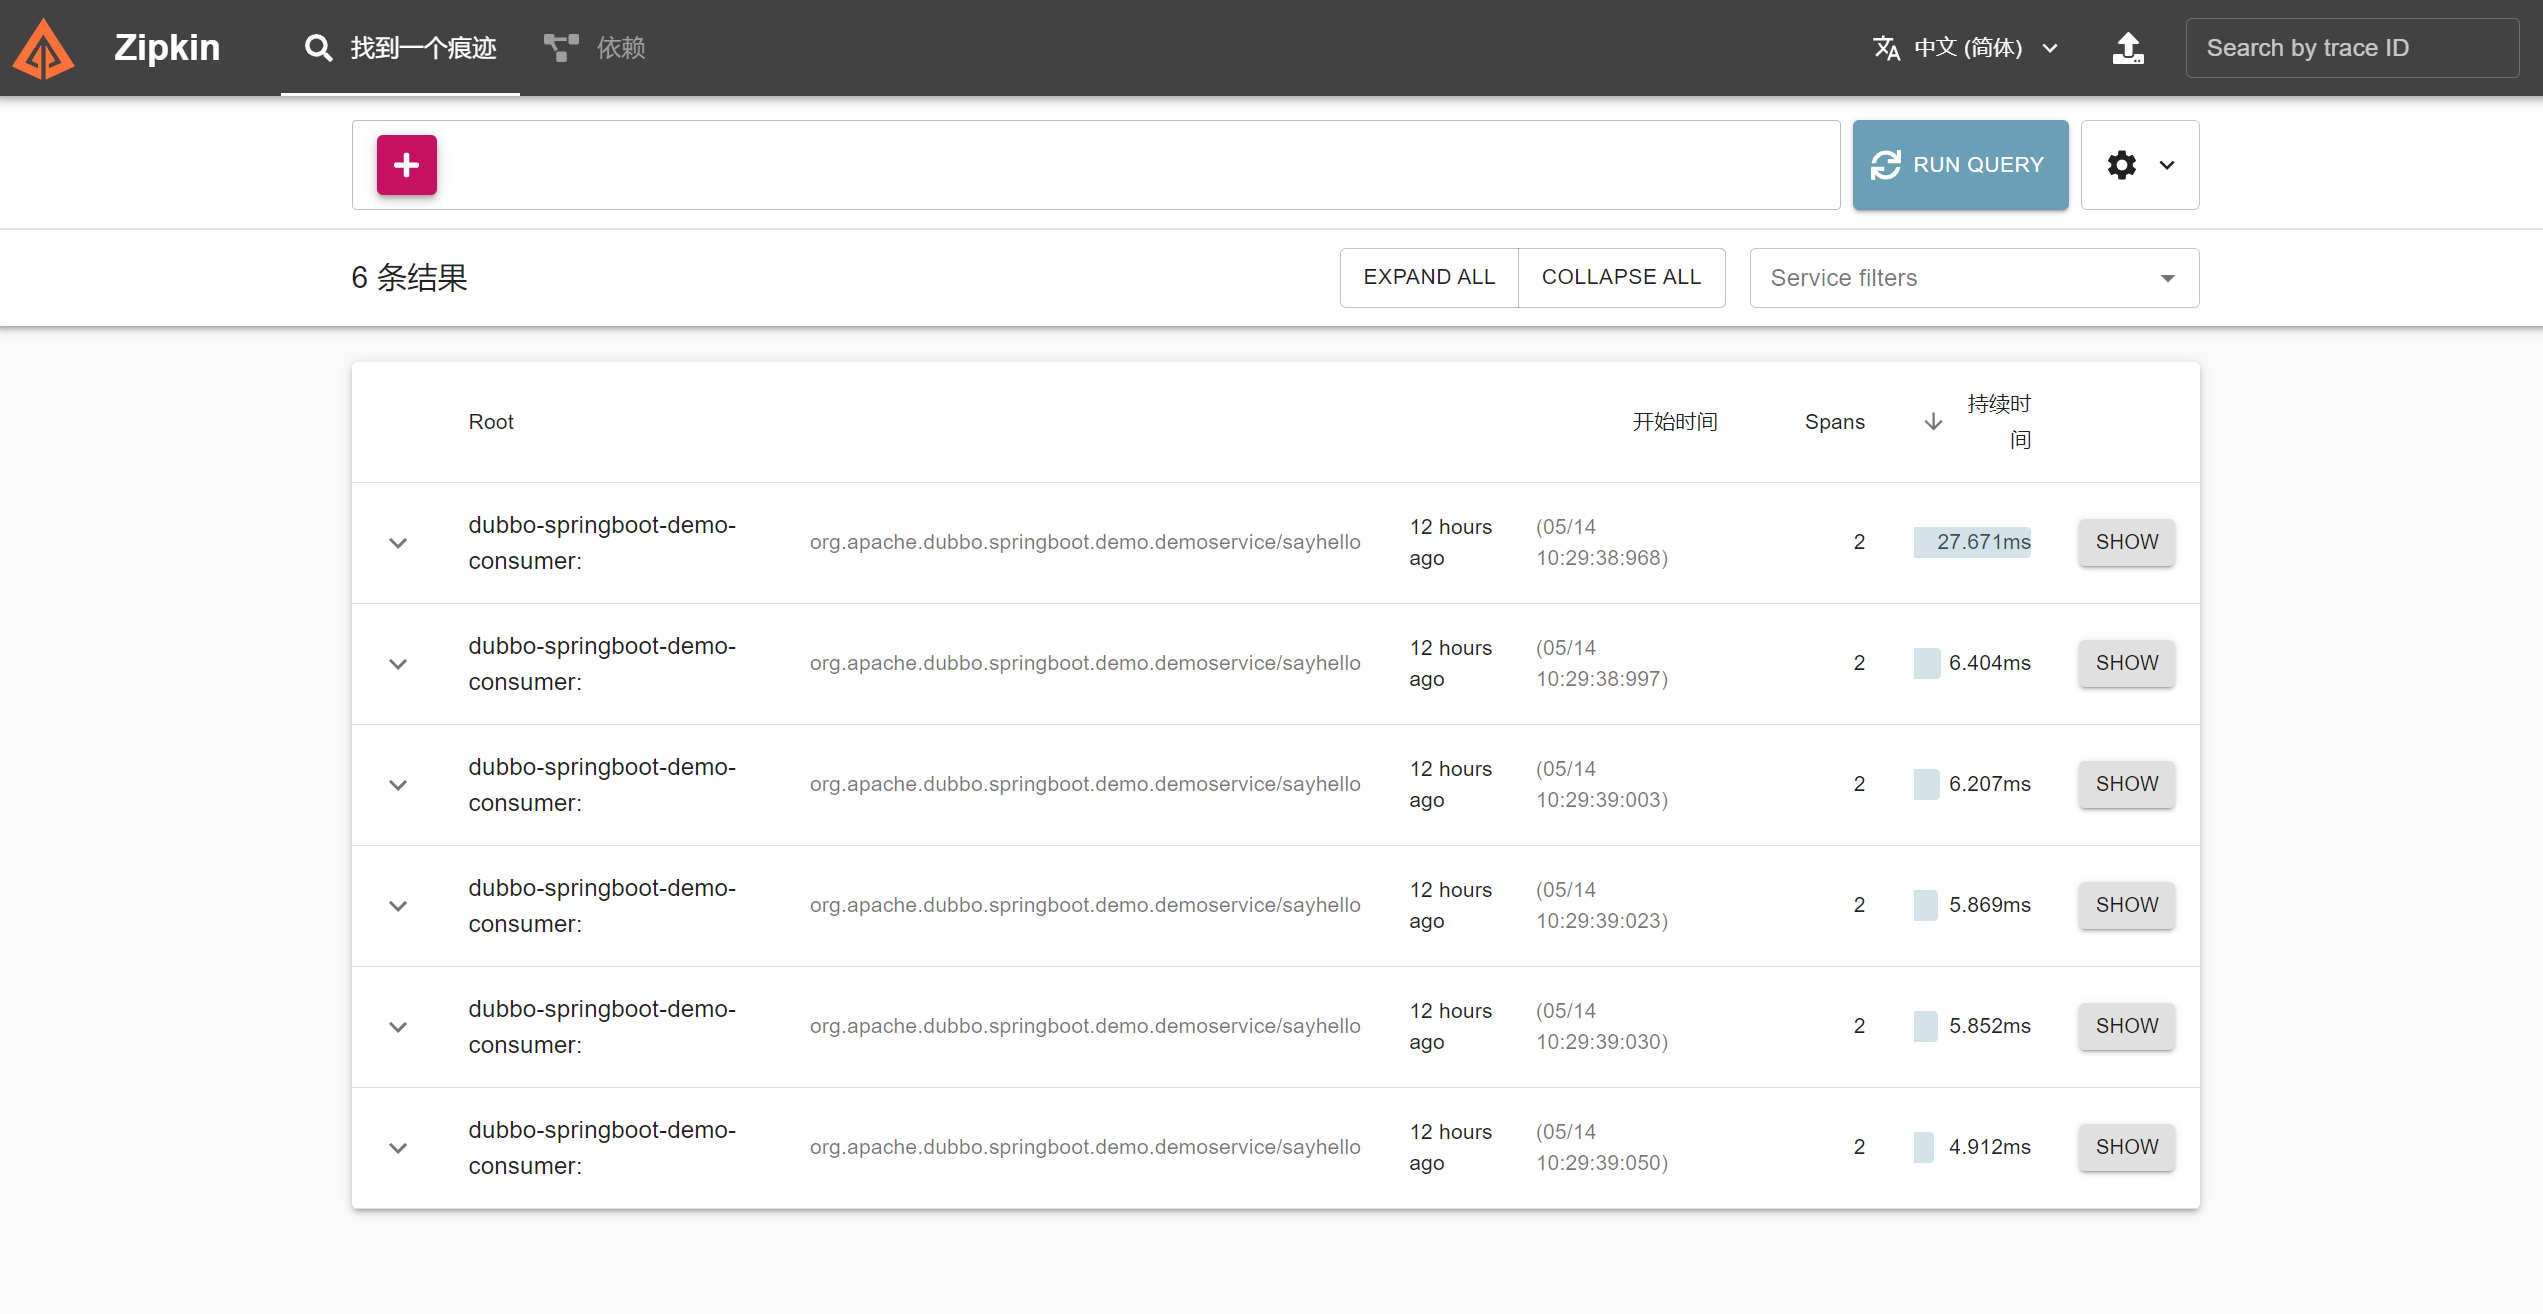
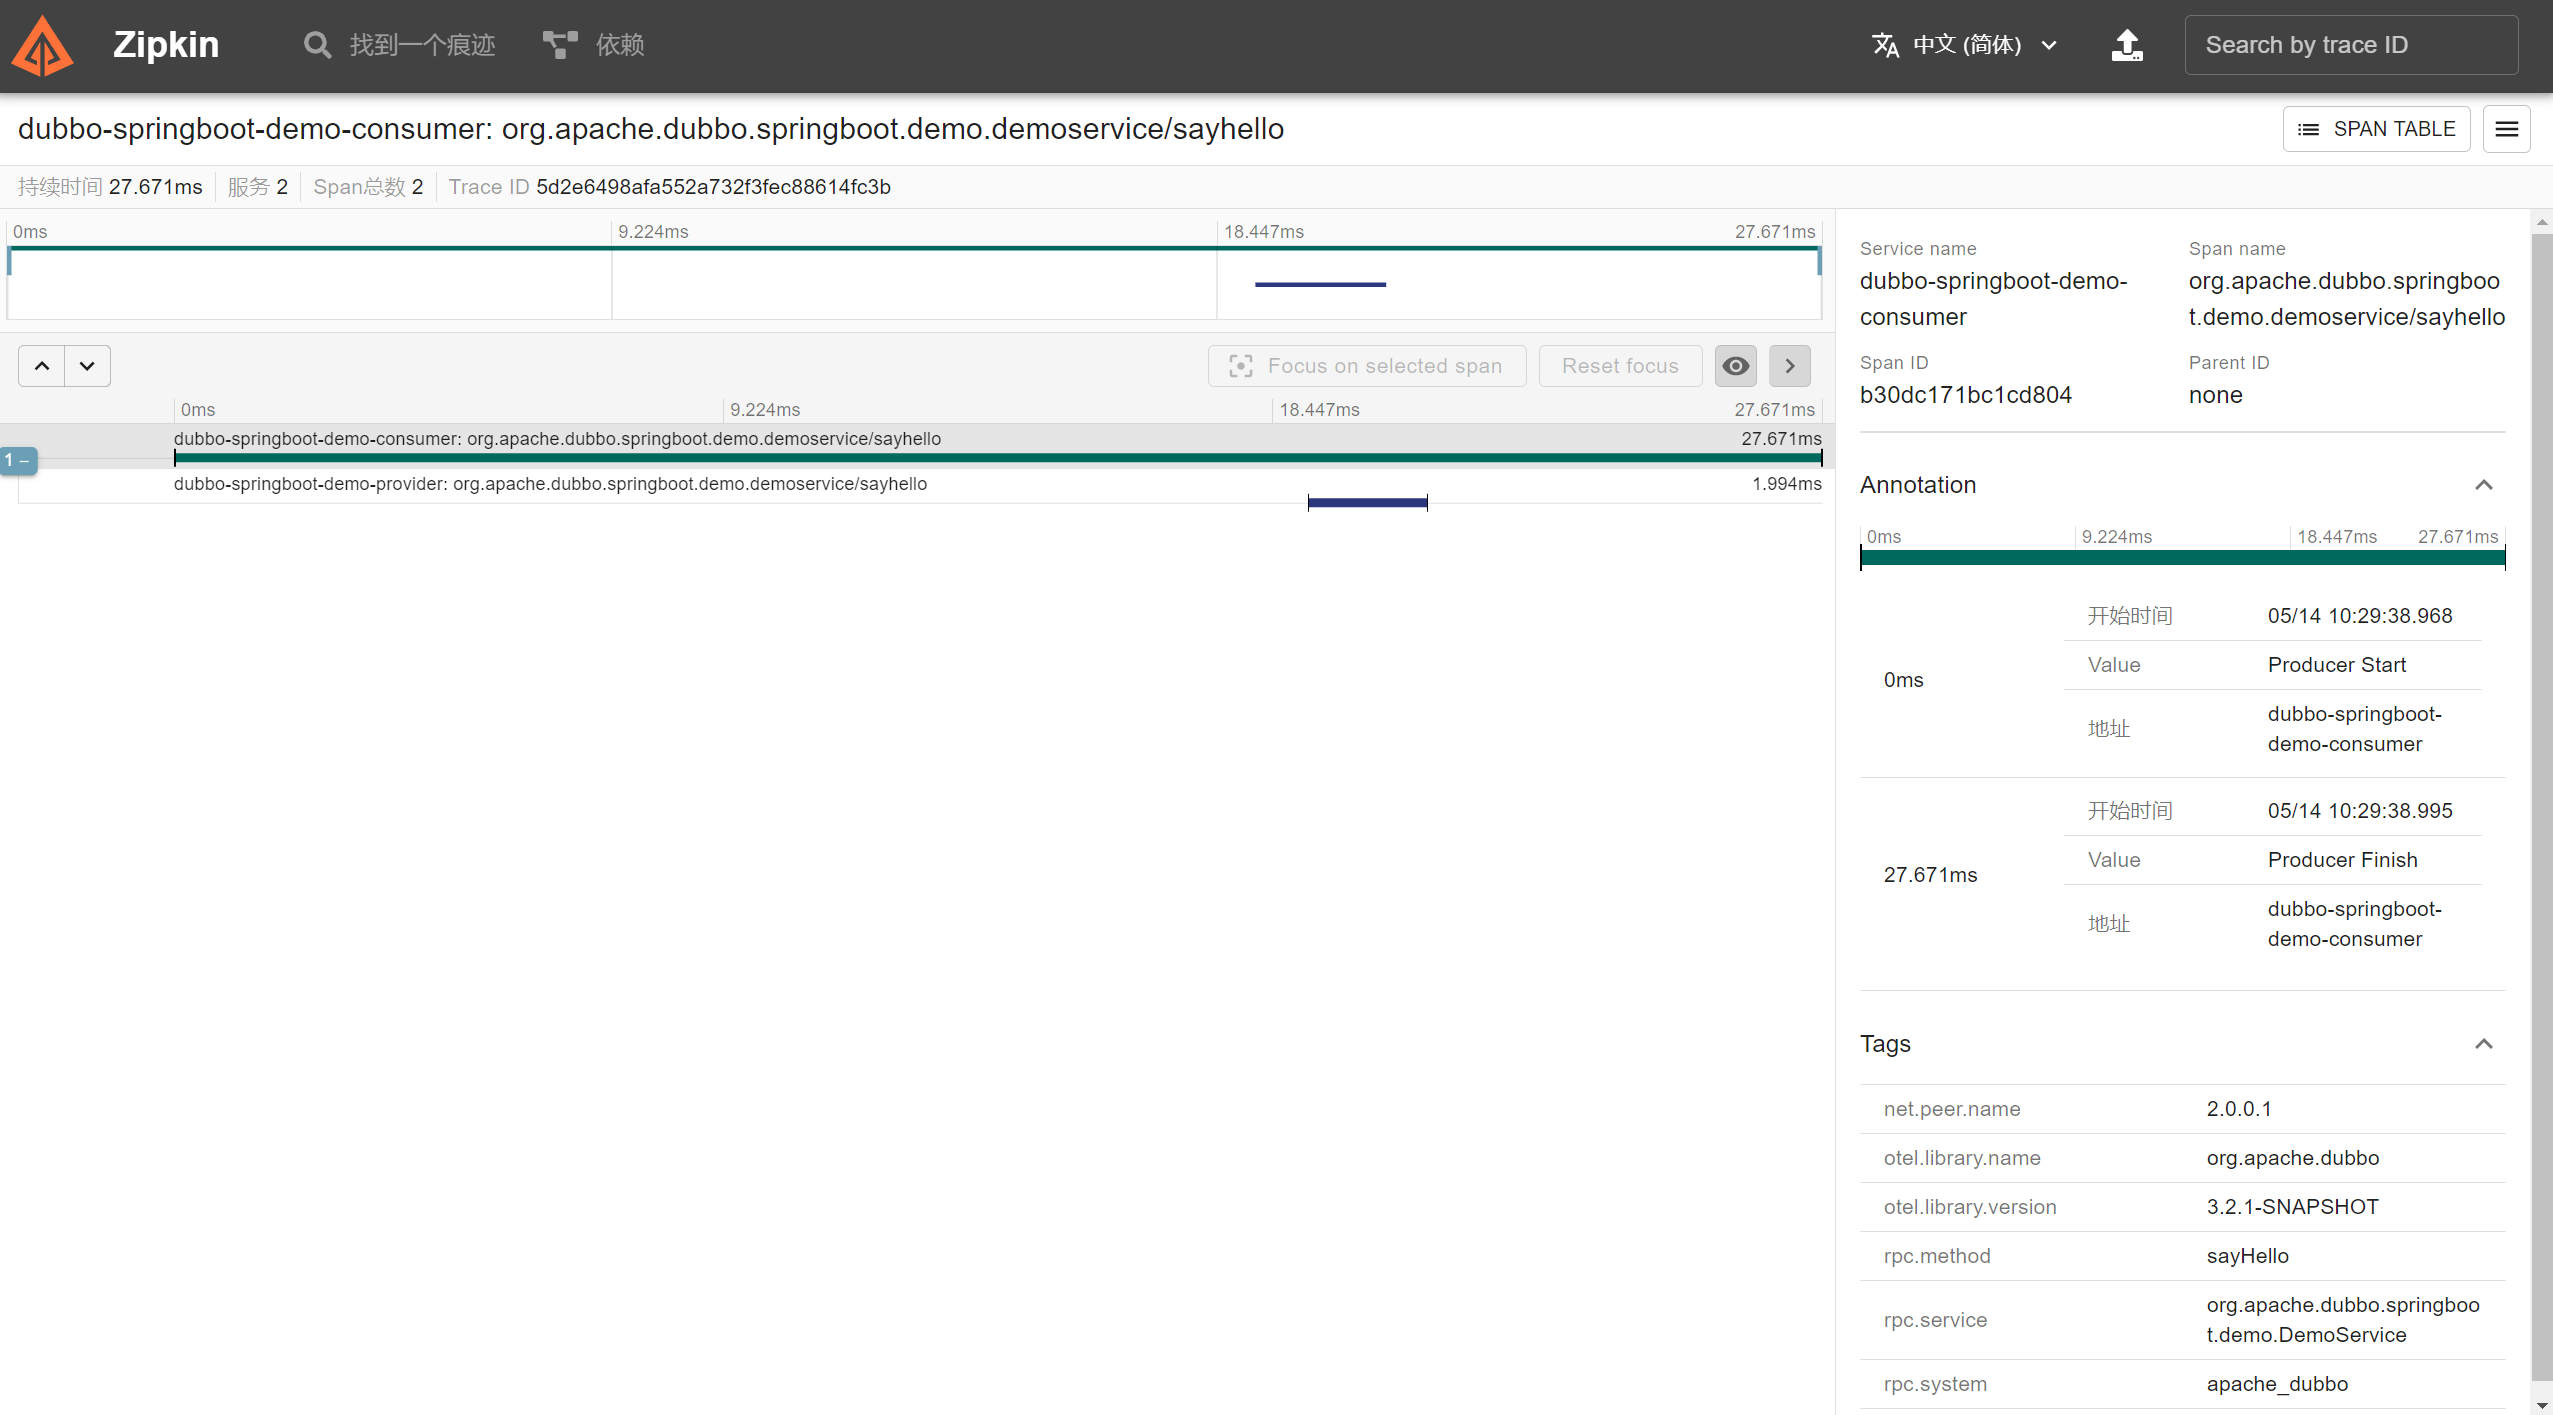
View trace information
Open the zipkin dashboard http://localhost:9411/zipkin/ in the browser:
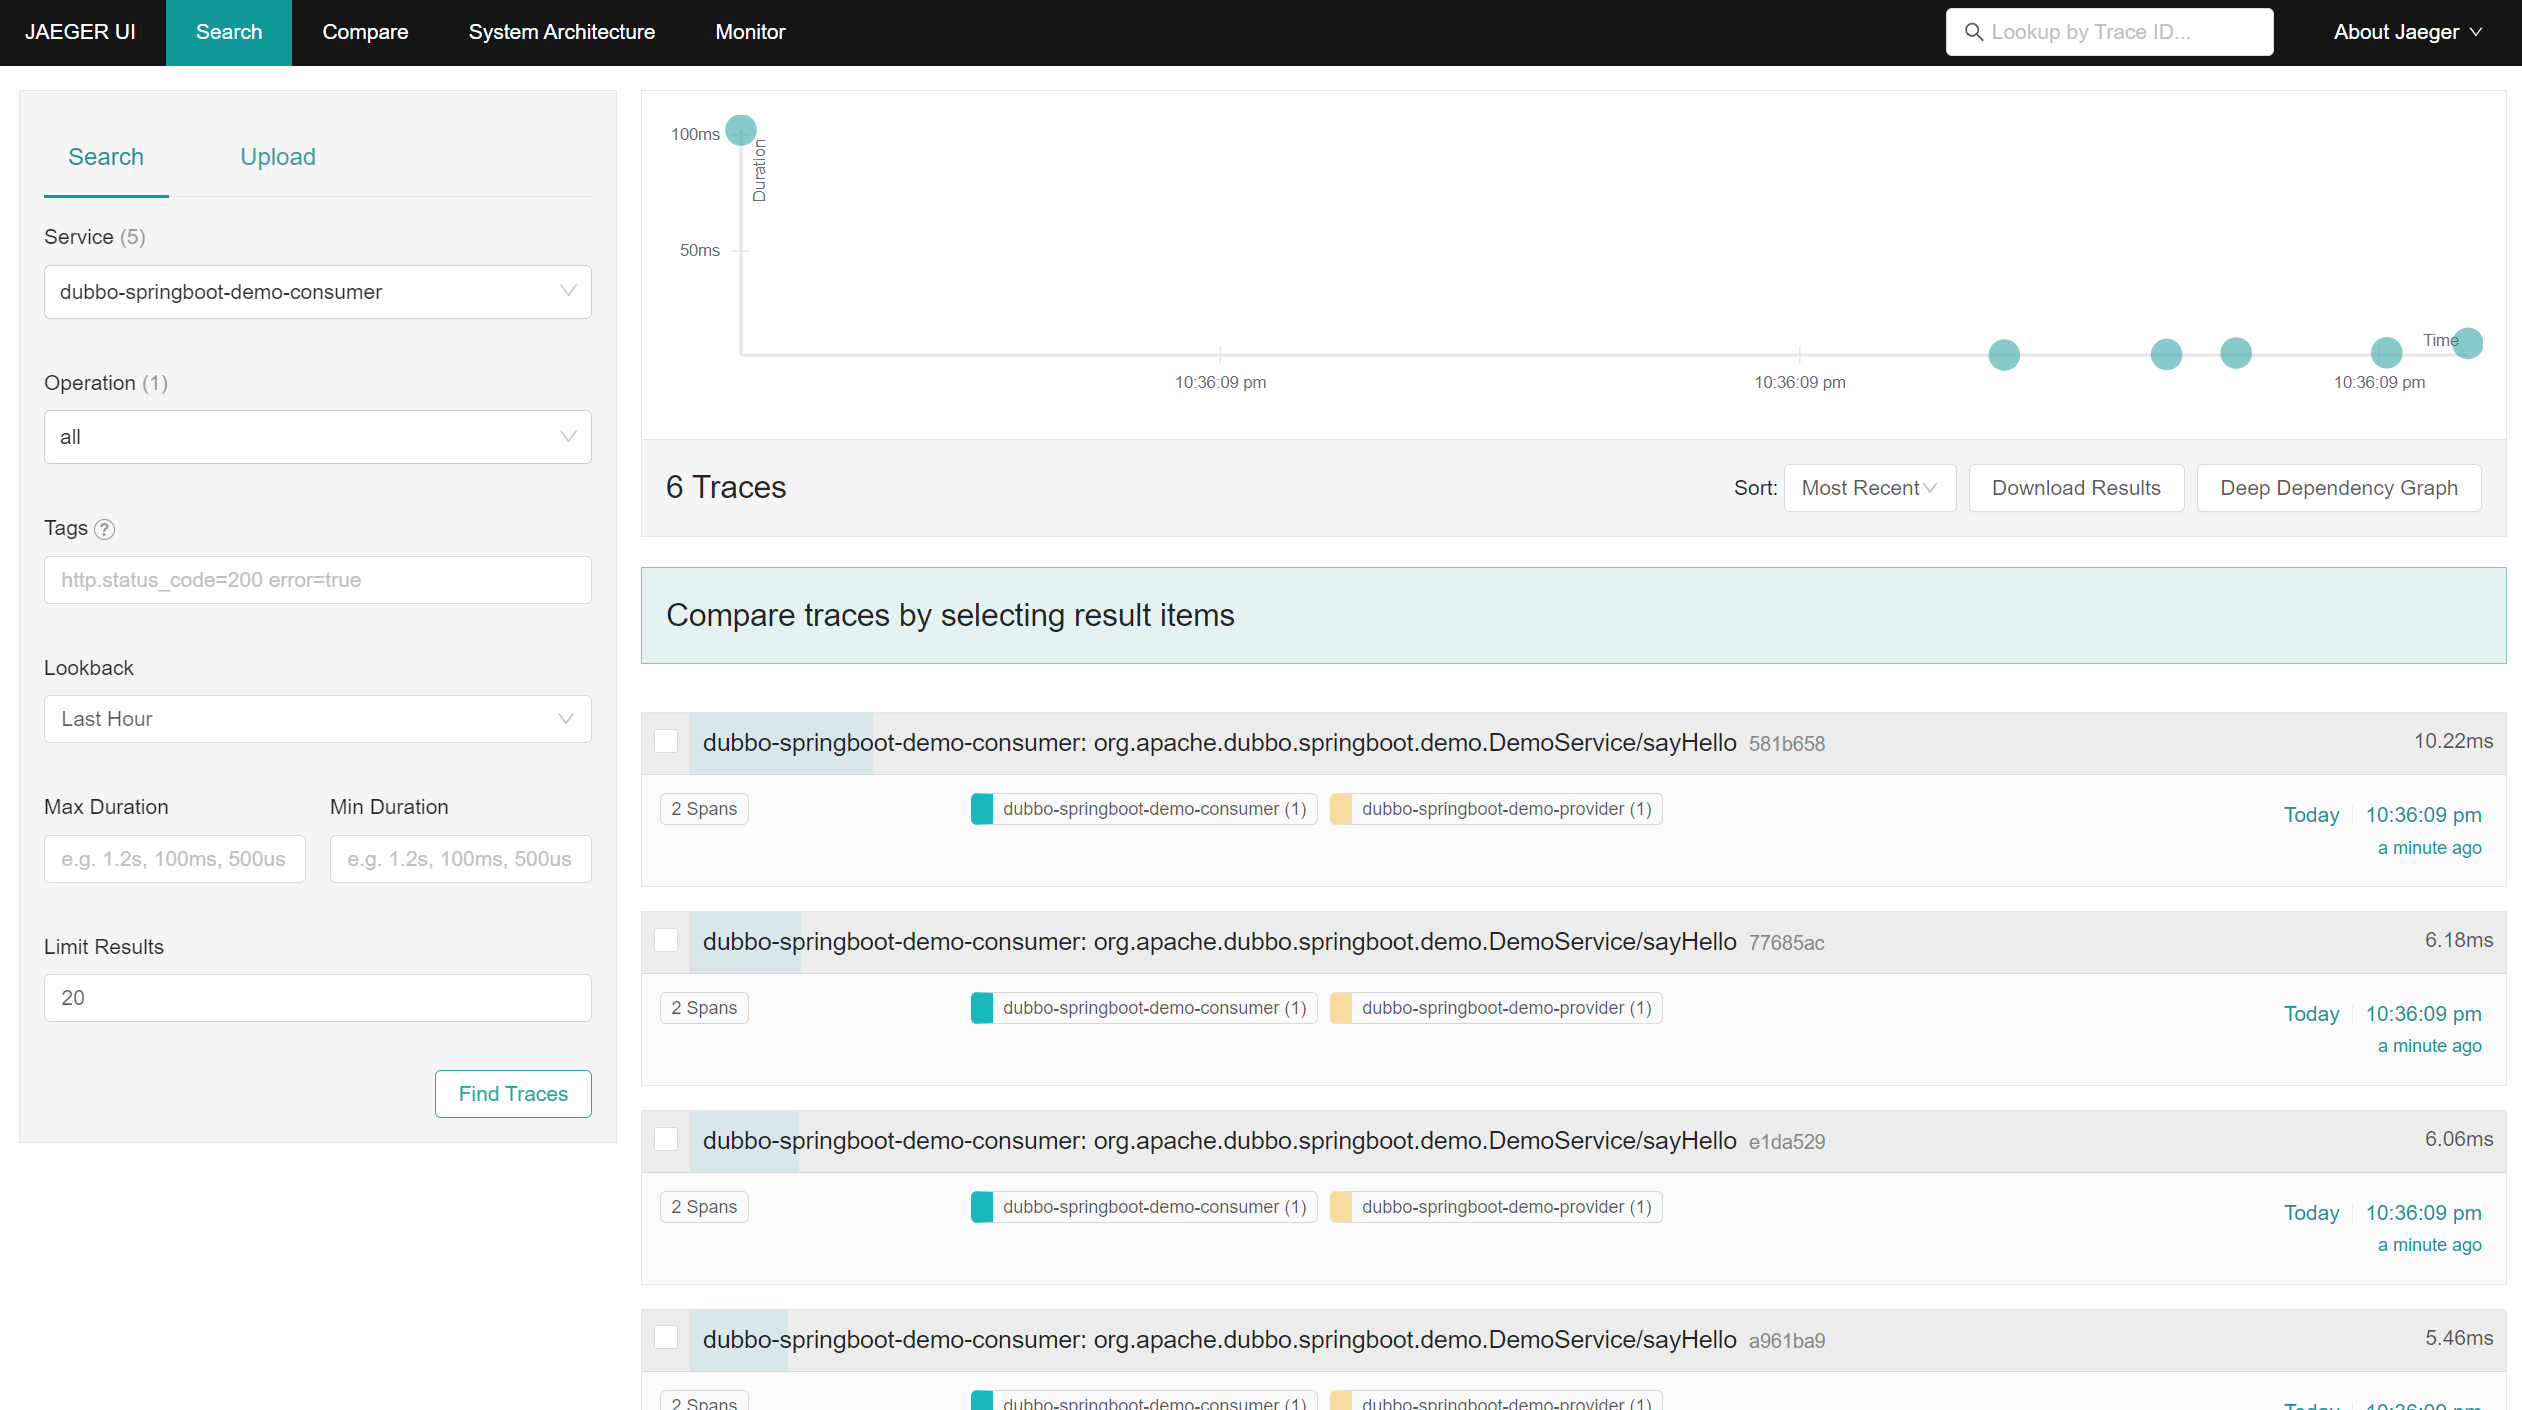
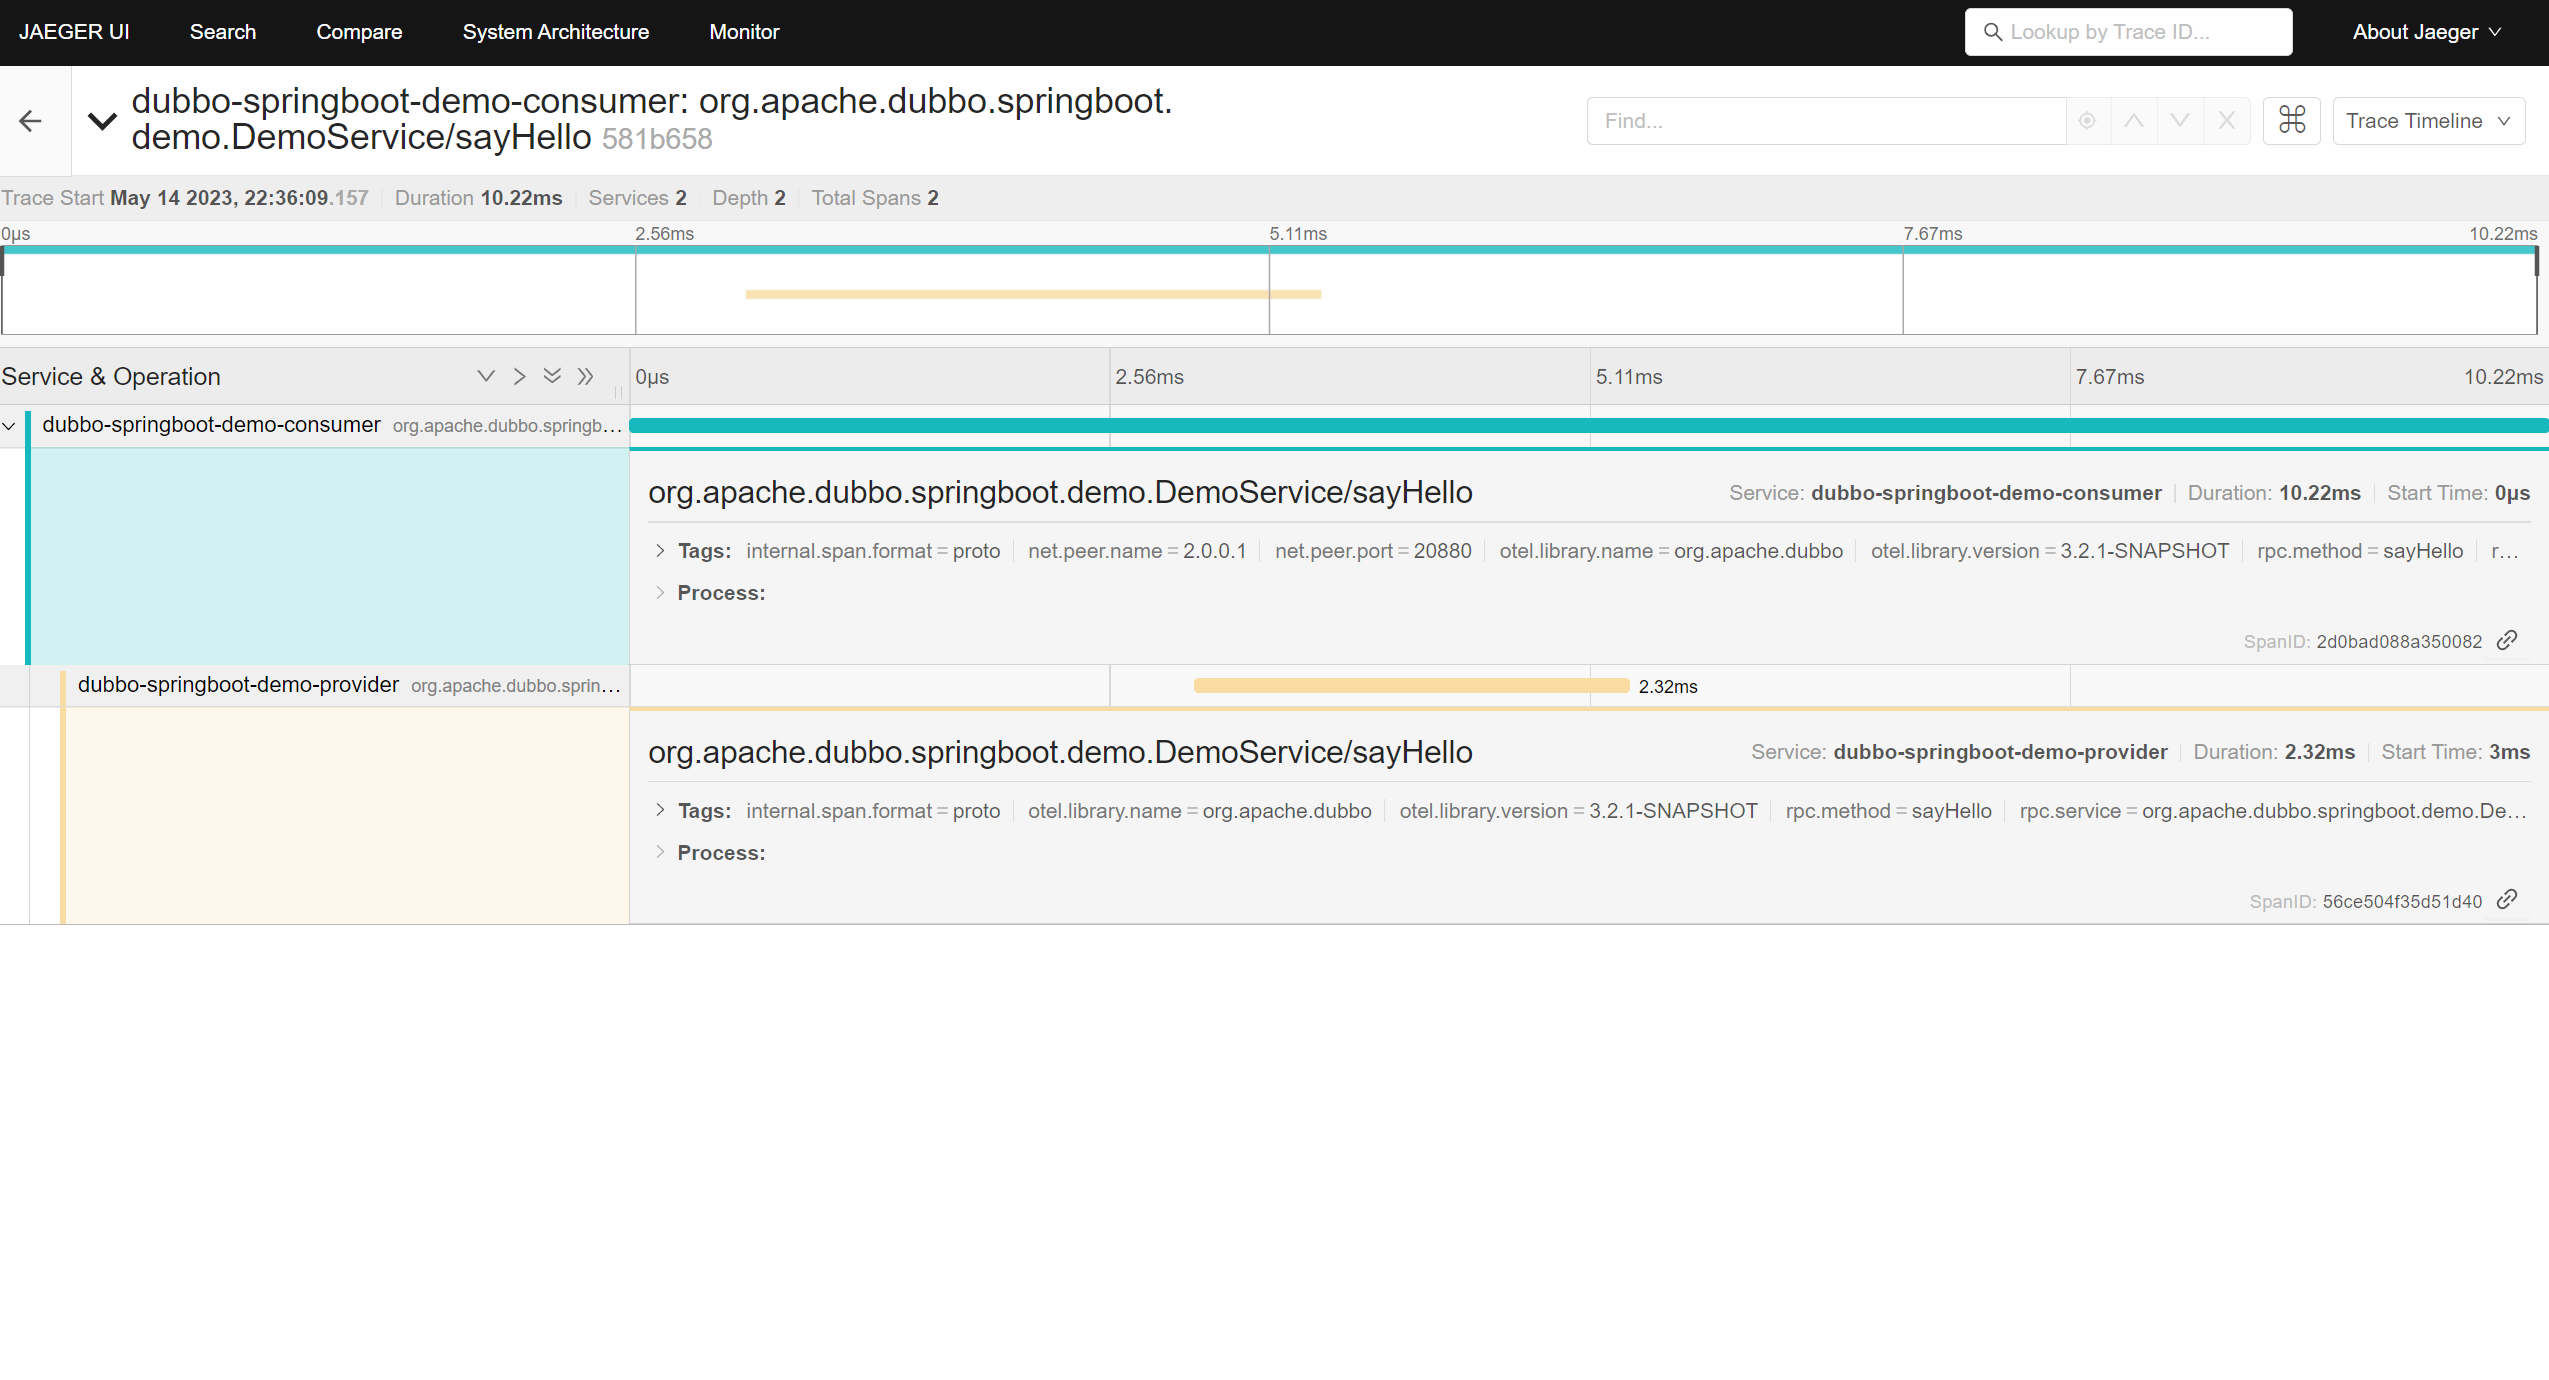
Open the Jaeger dashboard http://localhost:16686/search in the browser:
How to use it in Spring Boot project
1. Add dependencies to your project
For Spring Boot projects, you can use dubbo-spring-boot-tracing-otel-otlp-starter:
<!-- OpenTelemetry as Tracer, Otlp as exporter -->
<dependency>
    <groupId>org.apache.dubbo</groupId>
    <artifactId>dubbo-spring-boot-tracing-otel-otlp-starter</artifactId>
</dependency>
2. Configuration
application.yml
dubbo:
  tracing:
    enabled: true # default is false
    sampling:
      probability: 0.5 # sampling rate, default is 0.1
    propagation:
      type: W3C # W3C/B3 default is W3C
    tracing-exporter:
      otlp-config:
        endpoint: http://localhost:4317
        timeout: 10s # default is 10s
        compression-method: none # none/gzip The method used to compress payloads, default is "none"
        headers: # customized added headers, default is empty
          auth: admin

# tracing info output to logging
logging:
  level:
    root: info
  pattern:
    console: '[%d{dd/MM/yy HH:mm:ss:SSS z}] %t %5p %c{2} [%X{traceId:-}, %X{spanId:-}]: %m%n'
How to use based on Dubbo API
1. Add dependencies to your project
    <!-- Required, dubbo-tracing core dependency -->
    <dependency>
        <groupId>org.apache.dubbo</groupId>
        <artifactId>dubbo-tracing</artifactId>
    </dependency>
    <!-- Opentelemetry as Tracer -->
    <dependency>
        <groupId>io.micrometer</groupId>
        <artifactId>micrometer-tracing-bridge-otel</artifactId>
    </dependency>
    <!-- OTlp as exporter -->
    <dependency>
        <groupId>io.opentelemetry</groupId>
        <artifactId>opentelemetry-exporter-otlp</artifactId>
    </dependency>
2. Configuration
TracingConfig tracingConfig = new TracingConfig();
// Enable dubbo tracing
tracingConfig.setEnabled(true);
// Set the sampling
tracingConfig.setSampling(new SamplingConfig(1.0f));
// Set Propagation, default is W3C, optional W3C/B3
tracingConfig.setPropagation(new PropagationConfig("W3C"));
// Set trace reporting
ExporterConfig exporterConfig = new ExporterConfig();
// Set up trace reporting to Zipkin
exporterConfig.setZipkin(new ExporterConfig.OtlpConfig("http://localhost:4317", Duration.ofSeconds(10), "none"));
tracingConfig.setExporter(exporterConfig);