Metrics tracking
Overview
1. Metrics Access Instructions
2. Metrics System Design
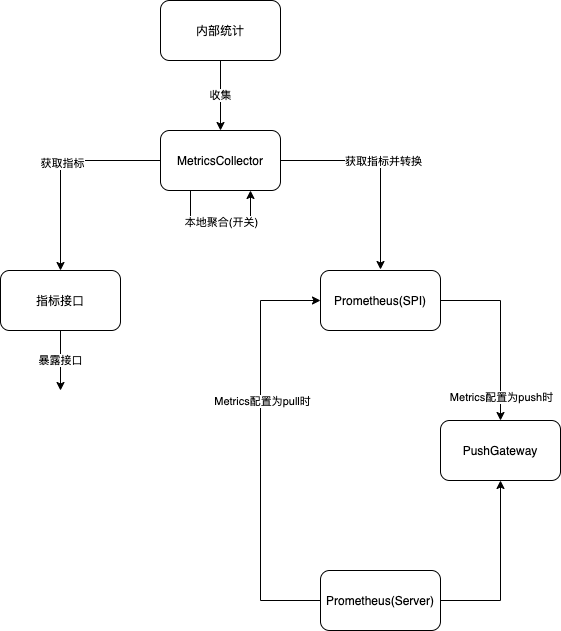
The metrics system of Dubbo involves three aspects: metrics collection, local aggregation, and metrics pushing.
- Metrics Collection: Push metrics that need to be monitored internally in Dubbo to a unified Collector for storage.
- Local Aggregation: Basic metrics are obtained from metrics collection, while some quantile metrics need to be calculated through local aggregation.
- Metrics Pushing: Collected and aggregated metrics are pushed to a third-party server in a specific manner, currently only involving Prometheus.
3. Structural Design
- Remove the original classes related to Metrics
- Create new modules dubbo-metrics/dubbo-metrics-api, dubbo-metrics/dubbo-metrics-prometheus, with MetricsConfig as the configuration class for these modules
- Use micrometer, and in the Collector, use basic types to represent metrics, such as Long, Double, etc., and introduce micrometer in dubbo-metrics-api to convert internal metrics.
4. Data Flow
5. Objectives
The metrics interface will provide a MetricsService, which not only provides interface-level data for flexible services but also offers ways to query all metrics. The method-level metrics query interface can be declared as follows:
public interface MetricsService {

    /**
     * Default {@link MetricsService} extension name.
     */
    String DEFAULT_EXTENSION_NAME = "default";

    /**
     * The contract version of {@link MetricsService}, future updates
must ensure compatibility.
     */
    String VERSION = "1.0.0";

    /**
     * Get metrics by prefixes
     *
     * @param categories categories
     * @return metrics - key=MetricCategory value=MetricsEntityList
     */
    Map<MetricsCategory, List<MetricsEntity>> getMetricsByCategories(List<MetricsCategory> categories);

    /**
     * Get metrics by interface and prefixes
     *
     * @param serviceUniqueName serviceUniqueName (eg.group/interfaceName:version)
     * @param categories categories
     * @return metrics - key=MetricCategory value=MetricsEntityList
     */
    Map<MetricsCategory, List<MetricsEntity>> getMetricsByCategories(String serviceUniqueName, List<MetricsCategory> categories);

    /**
     * Get metrics by interface, method, and prefixes
     *
     * @param serviceUniqueName serviceUniqueName (eg.group/interfaceName:version)
     * @param methodName methodName
     * @param parameterTypes method parameter types
     * @param categories categories
     * @return metrics - key=MetricCategory value=MetricsEntityList
     */
    Map<MetricsCategory, List<MetricsEntity>> getMetricsByCategories(String serviceUniqueName, String methodName, Class<?>[] parameterTypes, List<MetricsCategory> categories);
}
Where MetricsCategory is designed as follows:
public enum MetricsCategory {
    RT,
    QPS,
    REQUESTS,
}
MetricsEntity is designed as follows:
public class MetricsEntity {
    private String name;
    private Map<String, String> tags;
    private MetricsCategory category;
    private Object value;
}
Metrics Collection
1. Insertion Location
The architecture diagram of Dubbo is as follows:
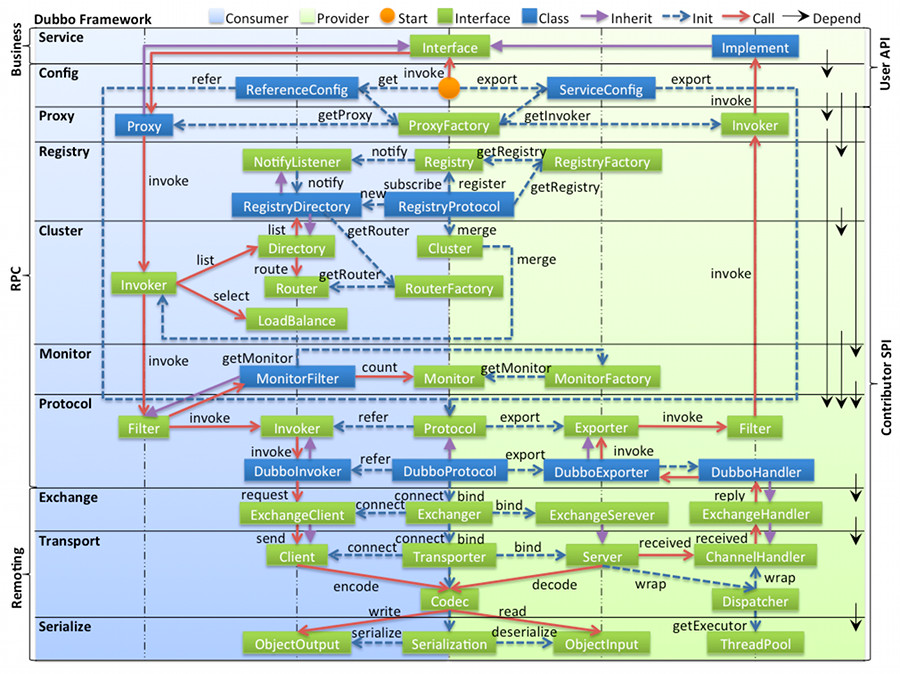
Add a layer of MetricsFilter in the provider to overwrite the invoke method and embed the call chain for metrics collection, handled using try-catch-finally. The core code is as follows:
@Activate(group = PROVIDER, order = -1)
public class MetricsFilter implements Filter, ScopeModelAware {
    @Override
    public Result invoke(Invoker<?> invoker, Invocation invocation) throws RpcException {
        collector.increaseTotalRequests(interfaceName, methodName, group, version);
        collector.increaseProcessingRequests(interfaceName, methodName, group, version);
        Long startTime = System.currentTimeMillis();
        try {
            Result invoke = invoker.invoke(invocation);
            collector.increaseSucceedRequests(interfaceName, methodName, group, version);
            return invoke;
        } catch (RpcException e) {
            collector.increaseFailedRequests(interfaceName, methodName, group, version);
            throw e;
        } finally {
            Long endTime = System.currentTimeMillis();
            Long rt = endTime - startTime;
            collector.addRT(interfaceName, methodName, group, version, rt);
            collector.decreaseProcessingRequests(interfaceName, methodName, group, version);
        }
    }
}
2. Metric Identification
Use the following five attributes as isolation levels to distinguish different methods, which are also the keys of various ConcurrentHashMap.
public class MethodMetric {
    private String applicationName;
    private String interfaceName;
    private String methodName;
    private String group;
    private String version;
}
3. Basic Metrics
Metrics are stored in the MetricsCollector under the common module.
public class DefaultMetricsCollector implements MetricsCollector {
    private Boolean collectEnabled = false;
    private final List<MetricsListener> listeners = new ArrayList<>();
    private final ApplicationModel applicationModel;
    private final String applicationName;

    private final Map<MethodMetric, AtomicLong> totalRequests = new ConcurrentHashMap<>();
    private final Map<MethodMetric, AtomicLong> succeedRequests = new ConcurrentHashMap<>();
    private final Map<MethodMetric, AtomicLong> failedRequests = new ConcurrentHashMap<>();
    private final Map<MethodMetric, AtomicLong> processingRequests = new ConcurrentHashMap<>();

    private final Map<MethodMetric, AtomicLong> lastRT = new ConcurrentHashMap<>();
    private final Map<MethodMetric, LongAccumulator> minRT = new ConcurrentHashMap<>();
    private final Map<MethodMetric, LongAccumulator> maxRT = new ConcurrentHashMap<>();
    private final Map<MethodMetric, AtomicLong> avgRT = new ConcurrentHashMap<>();
    private final Map<MethodMetric, AtomicLong> totalRT = new ConcurrentHashMap<>();
    private final Map<MethodMetric, AtomicLong> rtCount = new ConcurrentHashMap<>();
 }
Local Aggregation
Local aggregation refers to the process of obtaining quantile metrics through calculations based on some simple metrics.
1. Parameter Design
When collecting metrics, only basic metrics are collected by default, while some single-machine aggregation metrics need to enable service flexibility or local aggregation to compute in a separate thread. If service flexibility is enabled here, local aggregation is enabled by default.
1.1 Local Aggregation Enablement
<dubbo:metrics>
  <dubbo:aggregation enable="true" />
</dubbo:metrics>
1.2 Metrics Aggregation Parameters
<dubbo:metrics>
  <dubbo:aggregation enable="true" bucket-num="5" time-window-seconds="10"/>
</dubbo:metrics>
2. Specific Metrics
The metrics module of Dubbo helps users observe the internal service status of the running system from the outside. Dubbo refers to the “Four Golden Signals”, RED Method, USE Method, and other theories combined with practical enterprise application scenarios to provide a rich set of key metrics from different dimensions. Focusing on these core metrics is crucial for providing usable services.
Key metrics of Dubbo include: Latency, Traffic, Errors, and Saturation. To better monitor service operation status, Dubbo also provides monitoring for core component states, such as Dubbo application information, thread pool information, and metrics data for interaction with the three major centers.
Key monitoring metrics in Dubbo mainly include:
| Infrastructure | Business Monitoring | |
|---|---|---|
| Latency | IO wait; Network latency; | Average time consumed by interfaces and services, TP90, TP99, TP999, etc. |
| Traffic | Network and disk IO; | QPS at the service level, |
| Errors | Downtime; Disk (bad disk or file system error); Process or port crash; Network packet loss; | Error logs; Business status codes, trends of error codes; |
| Saturation | System resource utilization: CPU, memory, disk, network; Saturation: number of waiting threads, queue backlog length; | This mainly includes JVM, thread pools, etc. |
- qps: dynamically obtained qps based on a sliding window
- rt: dynamically obtained rt based on a sliding window
- Number of failed requests: dynamically obtained number of failed requests in recent time based on a sliding window
- Number of successful requests: dynamically obtained number of successful requests in recent time based on a sliding window
- Number of requests being processed: simple statistics using pre-and post-Filters
- Specific metrics rely on a sliding window, with additional use of AggregateMetricsCollector for collection
Metrics output to Prometheus can be referenced as follows:
# HELP jvm_gc_live_data_size_bytes Size of long-lived heap memory pool after reclamation
# TYPE jvm_gc_live_data_size_bytes gauge
jvm_gc_live_data_size_bytes 1.6086528E7
# HELP requests_succeed_aggregate Aggregated Succeed Requests
# TYPE requests_succeed_aggregate gauge
requests_succeed_aggregate{application_name="metrics-provider",group="",hostname="iZ8lgm9icspkthZ",interface="org.apache.dubbo.samples.metrics.prometheus.api.DemoService",ip="172.28.236.104",method="sayHello",version="",} 39.0
# HELP jvm_buffer_memory_used_bytes An estimate of the memory that the Java virtual machine is using for this buffer pool
# TYPE jvm_buffer_memory_used_bytes gauge
jvm_buffer_memory_used_bytes{id="direct",} 1.679975E7
jvm_buffer_memory_used_bytes{id="mapped",} 0.0
# HELP jvm_gc_memory_allocated_bytes_total Incremented for an increase in the size of the (young) heap memory pool after one GC to before the next
# TYPE jvm_gc_memory_allocated_bytes_total counter
jvm_gc_memory_allocated_bytes_total 2.9884416E9
# HELP requests_total_aggregate Aggregated Total Requests
# TYPE requests_total_aggregate gauge
requests_total_aggregate{application_name="metrics-provider",group="",hostname="iZ8lgm9icspkthZ",interface="org.apache.dubbo.samples.metrics.prometheus.api.DemoService",ip="172.28.236.104",method="sayHello",version="",} 39.0
# HELP system_load_average_1m The sum of the number of runnable entities queued to available processors and the number of runnable entities running on the available processors averaged over a period of time
# TYPE system_load_average_1m gauge
system_load_average_1m 0.0
# HELP system_cpu_usage The "recent cpu usage" for the whole system
# TYPE system_cpu_usage gauge
system_cpu_usage 0.015802269043760128
# HELP jvm_threads_peak_threads The peak live thread count since the Java virtual machine started or peak was reset
# TYPE jvm_threads_peak_threads gauge
jvm_threads_peak_threads 40.0
# HELP requests_processing Processing Requests
# TYPE requests_processing gauge
requests_processing{application_name="metrics-provider",group="",hostname="iZ8lgm9icspkthZ",interface="org.apache.dubbo.samples.metrics.prometheus.api.DemoService",ip="172.28.236.104",method="sayHello",version="",} 0.0
# HELP jvm_memory_max_bytes The maximum amount of memory in bytes that can be used for memory management
# TYPE jvm_memory_max_bytes gauge
jvm_memory_max_bytes{area="nonheap",id="CodeHeap 'profiled nmethods'",} 1.22912768E8
jvm_memory_max_bytes{area="heap",id="G1 Survivor Space",} -1.0
jvm_memory_max_bytes{area="heap",id="G1 Old Gen",} 9.52107008E8
jvm_memory_max_bytes{area="nonheap",id="Metaspace",} -1.0
jvm_memory_max_bytes{area="heap",id="G1 Eden Space",} -1.0
jvm_memory_max_bytes{area="nonheap",id="CodeHeap 'non-nmethods'",} 5828608.0
jvm_memory_max_bytes{area="nonheap",id="Compressed Class Space",} 1.073741824E9
jvm_memory_max_bytes{area="nonheap",id="CodeHeap 'non-profiled nmethods'",} 1.22916864E8
# HELP jvm_threads_states_threads The current number of threads having BLOCKED state
# TYPE jvm_threads_states_threads gauge
jvm_threads_states_threads{state="blocked",} 0.0
jvm_threads_states_threads{state="runnable",} 10.0
jvm_threads_states_threads{state="waiting",} 16.0
jvm_threads_states_threads{state="timed-waiting",} 13.0
jvm_threads_states_threads{state="new",} 0.0
jvm_threads_states_threads{state="terminated",} 0.0
# HELP jvm_buffer_total_capacity_bytes An estimate of the total capacity of the buffers in this pool
# TYPE jvm_buffer_total_capacity_bytes gauge
jvm_buffer_total_capacity_bytes{id="direct",} 1.6799749E7
jvm_buffer_total_capacity_bytes{id="mapped",} 0.0
# HELP rt_p99 Response Time P99
# TYPE rt_p99 gauge
rt_p99{application_name="metrics-provider",group="",hostname="iZ8lgm9icspkthZ",interface="org.apache.dubbo.samples.metrics.prometheus.api.DemoService",ip="172.28.236.104",method="sayHello",version="",} 1.0
# HELP jvm_memory_used_bytes The amount of used memory
# TYPE jvm_memory_used_bytes gauge
jvm_memory_used_bytes{area="heap",id="G1 Survivor Space",} 1048576.0
jvm_memory_used_bytes{area="nonheap",id="CodeHeap 'profiled nmethods'",} 1.462464E7
jvm_memory_used_bytes{area="heap",id="G1 Old Gen",} 1.6098728E7
jvm_memory_used_bytes{area="nonheap",id="Metaspace",} 4.0126952E7
jvm_memory_used_bytes{area="heap",id="G1 Eden Space",} 8.2837504E7
jvm_memory_used_bytes{area="nonheap",id="CodeHeap 'non-nmethods'",} 1372032.0
jvm_memory_used_bytes{area="nonheap",id="Compressed Class Space",} 4519248.0
jvm_memory_used_bytes{area="nonheap",id="CodeHeap 'non-profiled nmethods'",} 5697408.0
# HELP qps Query Per Seconds
# TYPE qps gauge
qps{application_name="metrics-provider",group="",hostname="iZ8lgm9icspkthZ",interface="org.apache.dubbo.samples.metrics.prometheus.api.DemoService",ip="172.28.236.104",method="sayHello",version="",} 0.3333333333333333
# HELP rt_min Min Response Time
# TYPE rt_min gauge
rt_min{application_name="metrics-provider",group="",hostname="iZ8lgm9icspkthZ",interface="org.apache.dubbo.samples.metrics.prometheus.api.DemoService",ip="172.28.236.104",method="sayHello",version="",} 0.0
# HELP jvm_buffer_count_buffers An estimate of the number of buffers in the pool
# TYPE jvm_buffer_count_buffers gauge
jvm_buffer_count_buffers{id="mapped",} 0.0
jvm_buffer_count_buffers{id="direct",} 10.0
# HELP system_cpu_count The number of processors available to the Java virtual machine
# TYPE system_cpu_count gauge
system_cpu_count 2.0
# HELP jvm_classes_loaded_classes The number of classes that are currently loaded in the Java virtual machine
# TYPE jvm_classes_loaded_classes gauge
jvm_classes_loaded_classes 7325.0
# HELP rt_total Total Response Time
# TYPE rt_total gauge
rt_total{application_name="metrics-provider",group="",hostname="iZ8lgm9icspkthZ",interface="org.apache.dubbo.samples.metrics.prometheus.api.DemoService",ip="172.28.236.104",method="sayHello",version="",} 2783.0
# HELP rt_last Last Response Time
# TYPE rt_last gauge
rt_last{application_name="metrics-provider",group="",hostname="iZ8lgm9icspkthZ",interface="org.apache.dubbo.samples.metrics.prometheus.api.DemoService",ip="172.28.236.104",method="sayHello",version="",} 0.0
# HELP jvm_gc_memory_promoted_bytes_total Count of positive increases in the size of the old generation memory pool before GC to after GC
# TYPE jvm_gc_memory_promoted_bytes_total counter
jvm_gc_memory_promoted_bytes_total 1.4450952E7
# HELP jvm_gc_pause_seconds Time spent in GC pause
# TYPE jvm_gc_pause_seconds summary
jvm_gc_pause_seconds_count{action="end of minor GC",cause="Metadata GC Threshold",} 2.0
jvm_gc_pause_seconds_sum{action="end of minor GC",cause="Metadata GC Threshold",} 0.026
jvm_gc_pause_seconds_count{action="end of minor GC",cause="G1 Evacuation Pause",} 37.0
jvm_gc_pause_seconds_sum{action="end of minor GC",cause="G1 Evacuation Pause",} 0.156
# HELP jvm_gc_pause_seconds_max Time spent in GC pause
# TYPE jvm_gc_pause_seconds_max gauge
jvm_gc_pause_seconds_max{action="end of minor GC",cause="Metadata GC Threshold",} 0.0
jvm_gc_pause_seconds_max{action="end of minor GC",cause="G1 Evacuation Pause",} 0.0
# HELP rt_p95 Response Time P95
# TYPE rt_p95 gauge
rt_p95{application_name="metrics-provider",group="",hostname="iZ8lgm9icspkthZ",interface="org.apache.dubbo.samples.metrics.prometheus.api.DemoService",ip="172.28.236.104",method="sayHello",version="",} 0.0
# HELP requests_total Total Requests
# TYPE requests_total gauge
requests_total{application_name="metrics-provider",group="",hostname="iZ8lgm9icspkthZ",interface="org.apache.dubbo.samples.metrics.prometheus.api.DemoService",ip="172.28.236.104",method="sayHello",version="",} 27738.0
# HELP process_cpu_usage The "recent cpu usage" for the Java Virtual Machine process
# TYPE process_cpu_usage gauge
process_cpu_usage 8.103727714748784E-4
# HELP rt_max Max Response Time
# TYPE rt_max gauge
rt_max{application_name="metrics-provider",group="",hostname="iZ8lgm9icspkthZ",interface="org.apache.dubbo.samples.metrics.prometheus.api.DemoService",ip="172.28.236.104",method="sayHello",version="",} 4.0
# HELP jvm_gc_max_data_size_bytes Max size of long-lived heap memory pool
# TYPE jvm_gc_max_data_size_bytes gauge
jvm_gc_max_data_size_bytes 9.52107008E8
# HELP jvm_threads_live_threads The current number of live threads including both daemon and non-daemon threads
# TYPE jvm_threads_live_threads gauge
jvm_threads_live_threads 39.0
# HELP jvm_threads_daemon_threads The current number of live daemon threads
# TYPE jvm_threads_daemon_threads gauge
jvm_threads_daemon_threads 36.0
# HELP jvm_classes_unloaded_classes_total The total number of classes unloaded since the Java virtual machine has started execution
# TYPE jvm_classes_unloaded_classes_total counter
jvm_classes_unloaded_classes_total 0.0
# HELP jvm_memory_committed_bytes The amount of memory in bytes that is committed for the Java virtual machine to use
# TYPE jvm_memory_committed_bytes gauge
jvm_memory_committed_bytes{area="nonheap",id="CodeHeap 'profiled nmethods'",} 1.4680064E7
jvm_memory_committed_bytes{area="heap",id="G1 Survivor Space",} 1048576.0
jvm_memory_committed_bytes{area="heap",id="G1 Old Gen",} 5.24288E7
jvm_memory_committed_bytes{area="nonheap",id="Metaspace",} 4.1623552E7
jvm_memory_committed_bytes{area="heap",id="G1 Eden Space",} 9.0177536E7
jvm_memory_committed_bytes{area="nonheap",id="CodeHeap 'non-nmethods'",} 2555904.0
jvm_memory_committed_bytes{area="nonheap",id="Compressed Class Space",} 5111808.0
jvm_memory_committed_bytes{area="nonheap",id="CodeHeap 'non-profiled nmethods'",} 5701632.0
# HELP requests_succeed Succeed Requests
# TYPE requests_succeed gauge
requests_succeed{application_name="metrics-provider",group="",hostname="iZ8lgm9icspkthZ",interface="org.apache.dubbo.samples.metrics.prometheus.api.DemoService",ip="172.28.236.104",method="sayHello",version="",} 27738.0
# HELP rt_avg Average Response Time
# TYPE rt_avg gauge
rt_avg{application_name="metrics-provider",group="",hostname="iZ8lgm9icspkthZ",interface="org.apache.dubbo.samples.metrics.prometheus.api.DemoService",ip="172.28.236.104",method="sayHello",version="",} 0.0
Aggregation Collector
public class AggregateMetricsCollector implements MetricsCollector, MetricsListener {
    private int bucketNum;
    private int timeWindowSeconds;

    private final Map<MethodMetric, TimeWindowCounter> totalRequests = new ConcurrentHashMap<>();
    private final Map<MethodMetric, TimeWindowCounter> succeedRequests = new ConcurrentHashMap<>();
    private final Map<MethodMetric, TimeWindowCounter> failedRequests = new ConcurrentHashMap<>();
    private final Map<MethodMetric, TimeWindowCounter> qps = new ConcurrentHashMap<>();
    private final Map<MethodMetric, TimeWindowQuantile> rt = new ConcurrentHashMap<>();

    private final ApplicationModel applicationModel;

    private static final Integer DEFAULT_COMPRESSION = 100;
    private static final Integer DEFAULT_BUCKET_NUM = 10;
    private static final Integer DEFAULT_TIME_WINDOW_SECONDS = 120;

// In the constructor, parse the configuration information

    public AggregateMetricsCollector(ApplicationModel applicationModel) {
        this.applicationModel = applicationModel;
        ConfigManager configManager = applicationModel.getApplicationConfigManager();
        MetricsConfig config = configManager.getMetrics().orElse(null);
        if (config != null && config.getAggregation() != null && Boolean.TRUE.equals(config.getAggregation().getEnabled())) {
            // only registered when aggregation is enabled.
            registerListener();

            AggregationConfig aggregation = config.getAggregation();
            this.bucketNum = aggregation.getBucketNum() == null ? DEFAULT_BUCKET_NUM : aggregation.getBucketNum();
            this.timeWindowSeconds = aggregation.getTimeWindowSeconds() == null ? DEFAULT_TIME_WINDOW_SECONDS : aggregation.getTimeWindowSeconds();
        }
    }
}
If local aggregation is enabled, listeners are added through the Spring BeanFactory, binding AggregateMetricsCollector with DefaultMetricsCollector, implementing a producer-consumer model. The DefaultMetricsCollector uses a list of listeners for easy expansion.
private void registerListener() {
    applicationModel.getBeanFactory().getBean(DefaultMetricsCollector.class).addListener(this);
}
3. Metrics Aggregation
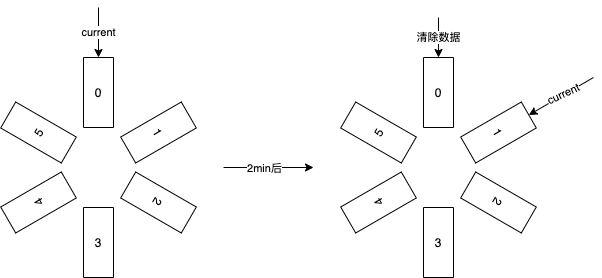
Sliding Window
Assuming we initially have 6 buckets, each with a window time set to 2 minutes.
Each time metrics data is written, it will be written into 6 buckets. Every two minutes, a bucket will be moved, and the data in the original bucket will be cleared.
When reading metrics, the current bucket pointed to by current will be read to achieve the sliding window effect.
As shown in the figure below, it implements that the current bucket stores data within the lifecycle of the bucket as configured, i.e., recent data.
In each bucket, the TDigest algorithm is used to calculate quantile metrics.
TDigest Algorithm (high accuracy for extreme quantiles, such as p1 p99, low accuracy for central quantiles, such as p50). Related materials are as follows:
The code implementation is as follows. In addition to TimeWindowQuantile for calculating quantile metrics, TimeWindowCounter is provided to collect the count of metrics within the time interval.
public class TimeWindowQuantile {
    private final double compression;
    private final TDigest[] ringBuffer;
    private int currentBucket;
    private long lastRotateTimestampMillis;
    private final long durationBetweenRotatesMillis;

    public TimeWindowQuantile(double compression, int bucketNum, int timeWindowSeconds) {
        this.compression = compression;
        this.ringBuffer = new TDigest[bucketNum];
        for (int i = 0; i < bucketNum; i++) {
            this.ringBuffer[i] = TDigest.createDigest(compression);
        }

        this.currentBucket = 0;
        this.lastRotateTimestampMillis = System.currentTimeMillis();
        this.durationBetweenRotatesMillis = TimeUnit.SECONDS.toMillis(timeWindowSeconds) / bucketNum;
    }

    public synchronized double quantile(double q) {
        TDigest currentBucket = rotate();
        return currentBucket.quantile(q);
    }

    public synchronized void add(double value) {
        rotate();
        for (TDigest bucket : ringBuffer) {
            bucket.add(value);
        }
    }

    private TDigest rotate() {
        long timeSinceLastRotateMillis = System.currentTimeMillis() - lastRotateTimestampMillis;
        while (timeSinceLastRotateMillis > durationBetweenRotatesMillis) {
            ringBuffer[currentBucket] = TDigest.createDigest(compression);
            if (++currentBucket >= ringBuffer.length) {
                currentBucket = 0;
            }
            timeSinceLastRotateMillis -= durationBetweenRotatesMillis;
            lastRotateTimestampMillis += durationBetweenRotatesMillis;
        }
        return ringBuffer[currentBucket];
    }
}
Metrics Push
Metrics pushing is only enabled when the user has set the <dubbo:metrics /> configuration and set the protocol parameter. If only metrics aggregation is enabled, no metrics will be pushed by default.
1. Prometheus Pull ServiceDiscovery
Using intermediate layers such as dubbo-admin, at startup, the local IP, Port, and MetricsURL push address information are pushed to dubbo-admin (or any intermediate layer) based on the configuration, exposing HTTP ServiceDiscovery for Prometheus to read, with the configuration like <dubbo:metrics protocol=“prometheus” mode=“pull” address="${dubbo-admin.address}" port=“20888” url="/metrics"/>. In pull mode, address is an optional parameter; if not filled, the user must manually configure the address in the Prometheus configuration file.
private void exportHttpServer() {
    boolean exporterEnabled = url.getParameter(PROMETHEUS_EXPORTER_ENABLED_KEY, false);
    if (exporterEnabled) {
        int port = url.getParameter(PROMETHEUS_EXPORTER_METRICS_PORT_KEY, PROMETHEUS_DEFAULT_METRICS_PORT);
        String path = url.getParameter(PROMETHEUS_EXPORTER_METRICS_PATH_KEY, PROMETHEUS_DEFAULT_METRICS_PATH);
        if (!path.startsWith("/")) {
            path = "/" + path;
        }

        try {
            prometheusExporterHttpServer = HttpServer.create(new InetSocketAddress(port), 0);
            prometheusExporterHttpServer.createContext(path, httpExchange -> {
                String response = prometheusRegistry.scrape();
                httpExchange.sendResponseHeaders(200, response.getBytes().length);
                try (OutputStream os = httpExchange.getResponseBody()) {
                    os.write(response.getBytes());
                }
            });

            httpServerThread = new Thread(prometheusExporterHttpServer::start);
            httpServerThread.start();
        } catch (IOException e) {
            throw new RuntimeException(e);
        }
    }
}
2. Prometheus Push Pushgateway
Users can directly configure the address of the Prometheus Pushgateway in the Dubbo configuration file, e.g. <dubbo:metrics protocol=“prometheus” mode=“push” address="${prometheus.pushgateway-url}" interval=“5” />, where the interval represents the push interval.
private void schedulePushJob() {
    boolean pushEnabled = url.getParameter(PROMETHEUS_PUSHGATEWAY_ENABLED_KEY, false);
    if (pushEnabled) {
        String baseUrl = url.getParameter(PROMETHEUS_PUSHGATEWAY_BASE_URL_KEY);
        String job = url.getParameter(PROMETHEUS_PUSHGATEWAY_JOB_KEY, PROMETHEUS_DEFAULT_JOB_NAME);
        int pushInterval = url.getParameter(PROMETHEUS_PUSHGATEWAY_PUSH_INTERVAL_KEY, PROMETHEUS_DEFAULT_PUSH_INTERVAL);
        String username = url.getParameter(PROMETHEUS_PUSHGATEWAY_USERNAME_KEY);
        String password = url.getParameter(PROMETHEUS_PUSHGATEWAY_PASSWORD_KEY);

        NamedThreadFactory threadFactory = new NamedThreadFactory("prometheus-push-job", true);
        pushJobExecutor = Executors.newScheduledThreadPool(1, threadFactory);
        PushGateway pushGateway = new PushGateway(baseUrl);
        if (!StringUtils.isBlank(username)) {
            pushGateway.setConnectionFactory(new BasicAuthHttpConnectionFactory(username, password));
        }

        pushJobExecutor.scheduleWithFixedDelay(() -> push(pushGateway, job), pushInterval, pushInterval, TimeUnit.SECONDS);
    }
}

protected void push(PushGateway pushGateway, String job) {
    try {
        pushGateway.pushAdd(prometheusRegistry.getPrometheusRegistry(), job);
    } catch (IOException e) {
        logger.error("Error occurred when pushing metrics to prometheus: ", e);
    }
}
Visualization
Currently, it is recommended to use Prometheus for service monitoring and Grafana to display metrics data. You can quickly get started with a case of Dubbo Visualization Monitoring .