Low Request Success Rate
In a production environment, the request success rate and latency are the most critical metrics. This article will introduce troubleshooting approaches when the request success rate decreases.
Summary in One Sentence
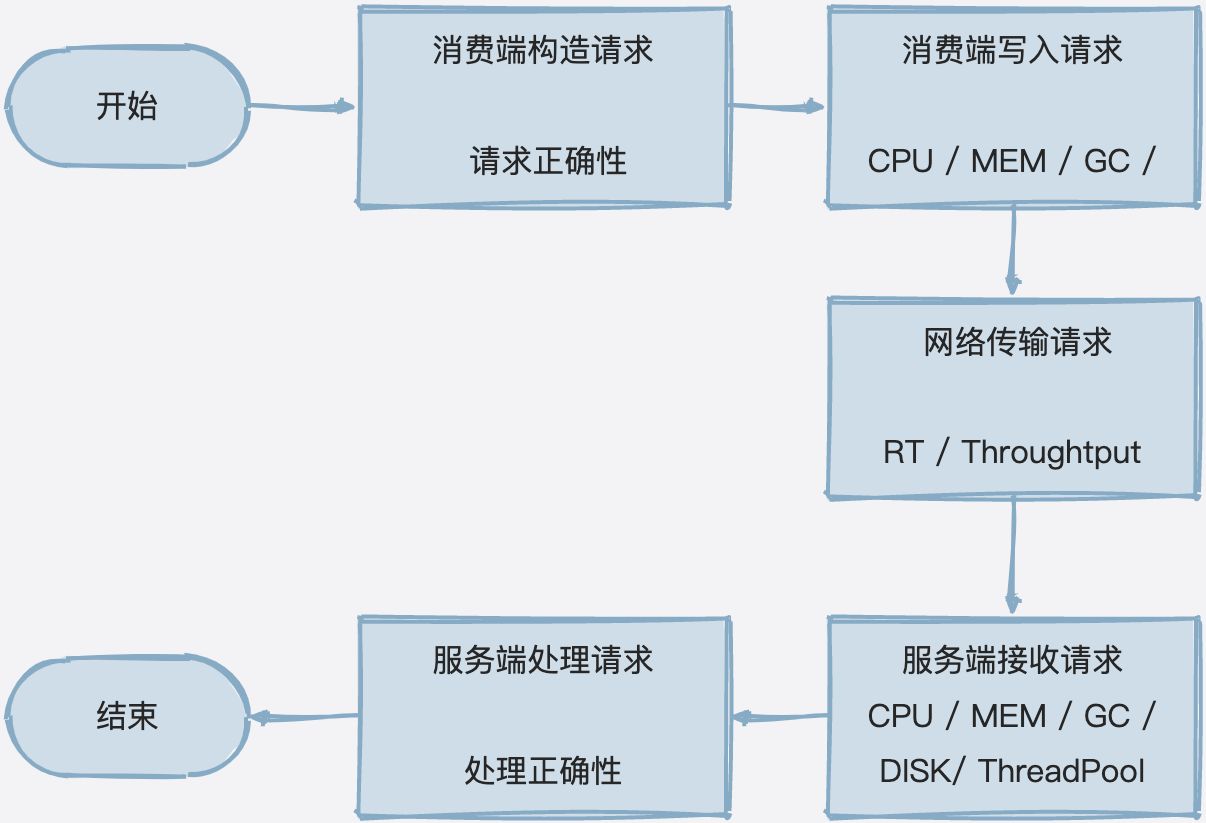
Analyze bottlenecks through end-to-end metrics (consumer end, network, server end, external dependencies, etc.)
Troubleshooting Approaches
1 Is the Consumer End Constructing Requests Normally?
1.1 Check if Class Objects Are Serializable
When using Dubbo for RPC remote calls, due to cross-process calls, Dubbo checks whether all data objects implement the Serializable interface to prevent unexpected data requests over the network.
Here is a sample log when a serialization exception is detected:
io.netty.handler.codec.EncoderException: java.lang.IllegalArgumentException: [Serialization Security] Serialized class org.apache.dubbo.samples.api.GreetingsService$Data has not implement Serializable interface. Current mode is strict check, will disallow to deserialize it by default.
	at io.netty.handler.codec.MessageToByteEncoder.write(MessageToByteEncoder.java:125)
	at io.netty.channel.AbstractChannelHandlerContext.invokeWrite0(AbstractChannelHandlerContext.java:881)
	at io.netty.channel.AbstractChannelHandlerContext.invokeWrite(AbstractChannelHandlerContext.java:863)
	at io.netty.channel.AbstractChannelHandlerContext.write(AbstractChannelHandlerContext.java:968)
	at io.netty.channel.AbstractChannelHandlerContext.write(AbstractChannelHandlerContext.java:856)
	at io.netty.handler.timeout.IdleStateHandler.write(IdleStateHandler.java:304)
	at io.netty.channel.AbstractChannelHandlerContext.invokeWrite0(AbstractChannelHandlerContext.java:879)
	at io.netty.channel.AbstractChannelHandlerContext.invokeWrite(AbstractChannelHandlerContext.java:863)
	at io.netty.channel.AbstractChannelHandlerContext.write(AbstractChannelHandlerContext.java:968)
	at io.netty.channel.AbstractChannelHandlerContext.write(AbstractChannelHandlerContext.java:856)
	at io.netty.channel.ChannelDuplexHandler.write(ChannelDuplexHandler.java:115)
	at org.apache.dubbo.remoting.transport.netty4.NettyClientHandler.write(NettyClientHandler.java:88)
	at io.netty.channel.AbstractChannelHandlerContext.invokeWrite0(AbstractChannelHandlerContext.java:879)
	at io.netty.channel.AbstractChannelHandlerContext.invokeWriteAndFlush(AbstractChannelHandlerContext.java:940)
	at io.netty.channel.AbstractChannelHandlerContext$WriteTask.run(AbstractChannelHandlerContext.java:1247)
	at io.netty.util.concurrent.AbstractEventExecutor.runTask(AbstractEventExecutor.java:174)
	at io.netty.util.concurrent.AbstractEventExecutor.safeExecute(AbstractEventExecutor.java:167)
	at io.netty.util.concurrent.SingleThreadEventExecutor.runAllTasks(SingleThreadEventExecutor.java:470)
	at io.netty.channel.nio.NioEventLoop.run(NioEventLoop.java:569)
	at io.netty.util.concurrent.SingleThreadEventExecutor$4.run(SingleThreadEventExecutor.java:997)
	at io.netty.util.internal.ThreadExecutorMap$2.run(ThreadExecutorMap.java:74)
	at io.netty.util.concurrent.FastThreadLocalRunnable.run(FastThreadLocalRunnable.java:30)
	at java.lang.Thread.run(Thread.java:748)
Caused by: java.lang.IllegalArgumentException: [Serialization Security] Serialized class org.apache.dubbo.samples.api.GreetingsService$Data has not implement Serializable interface. Current mode is strict check, will disallow to deserialize it by default.
	at org.apache.dubbo.common.utils.DefaultSerializeClassChecker.loadClass(DefaultSerializeClassChecker.java:112)
	at org.apache.dubbo.common.serialize.hessian2.Hessian2SerializerFactory.getDefaultSerializer(Hessian2SerializerFactory.java:49)
	at com.alibaba.com.caucho.hessian.io.SerializerFactory.getSerializer(SerializerFactory.java:393)
	at com.alibaba.com.caucho.hessian.io.Hessian2Output.writeObject(Hessian2Output.java:411)
	at org.apache.dubbo.common.serialize.hessian2.Hessian2ObjectOutput.writeObject(Hessian2ObjectOutput.java:99)
	at org.apache.dubbo.rpc.protocol.dubbo.DubboCodec.encodeRequestData(DubboCodec.java:208)
	at org.apache.dubbo.remoting.exchange.codec.ExchangeCodec.encodeRequest(ExchangeCodec.java:261)
	at org.apache.dubbo.remoting.exchange.codec.ExchangeCodec.encode(ExchangeCodec.java:75)
	at org.apache.dubbo.rpc.protocol.dubbo.DubboCountCodec.encode(DubboCountCodec.java:47)
	at org.apache.dubbo.remoting.transport.netty4.NettyCodecAdapter$InternalEncoder.encode(NettyCodecAdapter.java:69)
	at io.netty.handler.codec.MessageToByteEncoder.write(MessageToByteEncoder.java:107)
	... 22 more
Typical log keywords include has not implement Serializable interface.
If class information is reported with errors, please add the Serializable interface implementation and redeploy.
1.2 Check if Custom Extensions Are Functioning Normally
If you have extended Dubbo’s SPI mechanism with Filters, Clusters, Routers, etc., please check if there are any errors in their implementations as any component error will affect normal business requests.
2 Is the Consumer End Writing Requests Normally?
2.1 Check Machine Performance Metrics
When the consumer end initiates network requests, monitor the CPU status of the machine, such as usage rate and context switch counts. High machine load will also impact Dubbo’s request handling efficiency.
2.2 Check JVM Metrics
In addition to machine performance, the performance of the JVM also directly affects Dubbo. Monitor the following metrics of the JVM process:
- Number of GC times (especially Full GC)
- Young / Old Gen size
- C1 / C2 compilation status
For better observation of the JVM, you can use the Java Flight Recorder tool for sampling analysis.
3 Is Network Transmission Normal?
3.1 Check Network Reachability
For most applications deployed across multiple data centers, inter-machine communication goes through at least one switch. Check:
- If forwarding (routing) rules are normal
- If ACL allows Dubbo traffic
3.2 Check Network Latency and Retransmission Rates
Besides reachability, Dubbo is very sensitive to latency and retransmission, being a synchronous RPC framework. Check:
- RT between nodes
- Network packet loss rate
- Network retransmission rate (including TCP retransmission)
For packet loss and retransmission rates, use tcpdump for traffic sampling and analyze with wireshark. Dubbo defaults to a long connection reuse mode. Network jitter will severely affect all ongoing requests. To keep your request success rate close to 100%, ensure stable network RT with packet loss and retransmission rates close to 0.
3.3 Check Network Throughput
For users making cross-data-center calls, monitor network bandwidth metrics closely as reaching the provider’s maximum limit can lead to severe request packet loss, greatly impacting Dubbo.
4 Is the Server Receiving Requests Normally?
4.1 Check Machine Performance Metrics
During network request handling on the server side, monitor the CPU status, such as usage and context switch counts. High machine load will also affect Dubbo’s request handling efficiency.
4.2 Check JVM Metrics
Additionally, monitor the JVM’s performance metrics as mentioned earlier.
5 Is the Server Processing Requests Normally?
5.1 Check if the Server Thread Pool Is Full
Dubbo defaults to a concurrency limit of 200 (modifiable). If this limit is exceeded, new requests will be rejected to protect the server.
Sample log when the thread pool is full:
[27/02/23 05:37:40:040 CST] NettyServerWorker-5-2 WARN support.AbortPolicyWithReport: [DUBBO] Thread pool is EXHAUSTED! Thread Name: DubboServerHandler-30.221.144.195:20880, Pool Size: 20 (active: 20, core: 20, max: 20, largest: 20), Task: 27 (completed: 7), ...
Typical log keyword is Thread pool is EXHAUSTED.
Dubbo defaults to printing jstack information when an exception occurs in the user.home directory; you can also run jstack manually for troubleshooting.
5.2 Check for Traffic Limiting
If you have enabled Dubbo’s TPS limiting or introduced components like Sentinel or Hystrix for traffic limiting, check if the limiting values are triggered.
5.3 Check if Custom Extensions Are Working Normally
If you’ve extended Dubbo’s SPI for Filters or similar components, check if there are errors in their implementations, as any component error will affect normal business requests.
5.4 Check Server Processing Duration
If the processing duration on the server approaches or exceeds the timeout configured on the client, the client will quickly throw an exception.
Regarding server processing duration, refer to the following log:
[27/02/23 05:30:04:004 CST] DubboServerHandler-30.221.144.195:20880-thread-5  WARN filter.ProfilerServerFilter:  [DUBBO] [Dubbo-Provider] execute service org.apache.dubbo.samples.api.GreetingsService:0.0.0#sayHi cost 3001.533827 ms, this invocation almost (maybe already) timeout. Timeout: 1000ms
client: fd00:1:5:5200:a0a1:52b:e079:8582:58731
invocation context:
input=284;
path=org.apache.dubbo.samples.api.GreetingsService;
remote.application=first-dubbo-consumer;
dubbo=2.0.2;
interface=org.apache.dubbo.samples.api.GreetingsService;
version=0.0.0;
timeout=1000;
thread info:
Start time: 4237588012688
+-[ Offset: 0.000000ms; Usage: 3001.533827ms, 100% ] Receive request. Server invoke begin.
  +-[ Offset: 0.045578ms; Usage: 3001.436721ms, 99% ] Receive request. Server biz impl invoke begin., dubbo version: 3.1.7, current host: 30.221.144.195, error code: 3-7. This may be caused by , go to https://dubbo.apache.org/faq/3/7 to find instructions.
Search for logs related to execute service *** cost *** ms, this invocation almost (maybe already) timeout.
Typically when this log appears, your service implementation may be experiencing one of the following situations:
- Long lock waits
- External dependencies (RPC, MQ, Cache, DB, etc.) taking too long, requiring integration with a full-link tracking platform for diagnosis
- High machine load