End-to-End Tracing Usage and Implementation Instructions
Dubbo has built-in end-to-end tracing capabilities. You can enable link tracing by introducing spring-boot-starter or related dependencies. By exporting trace data to mainstream implementations such as Zipkin, Skywalking, Jaeger, etc., you can achieve analysis and visualization of end-to-end tracing data.
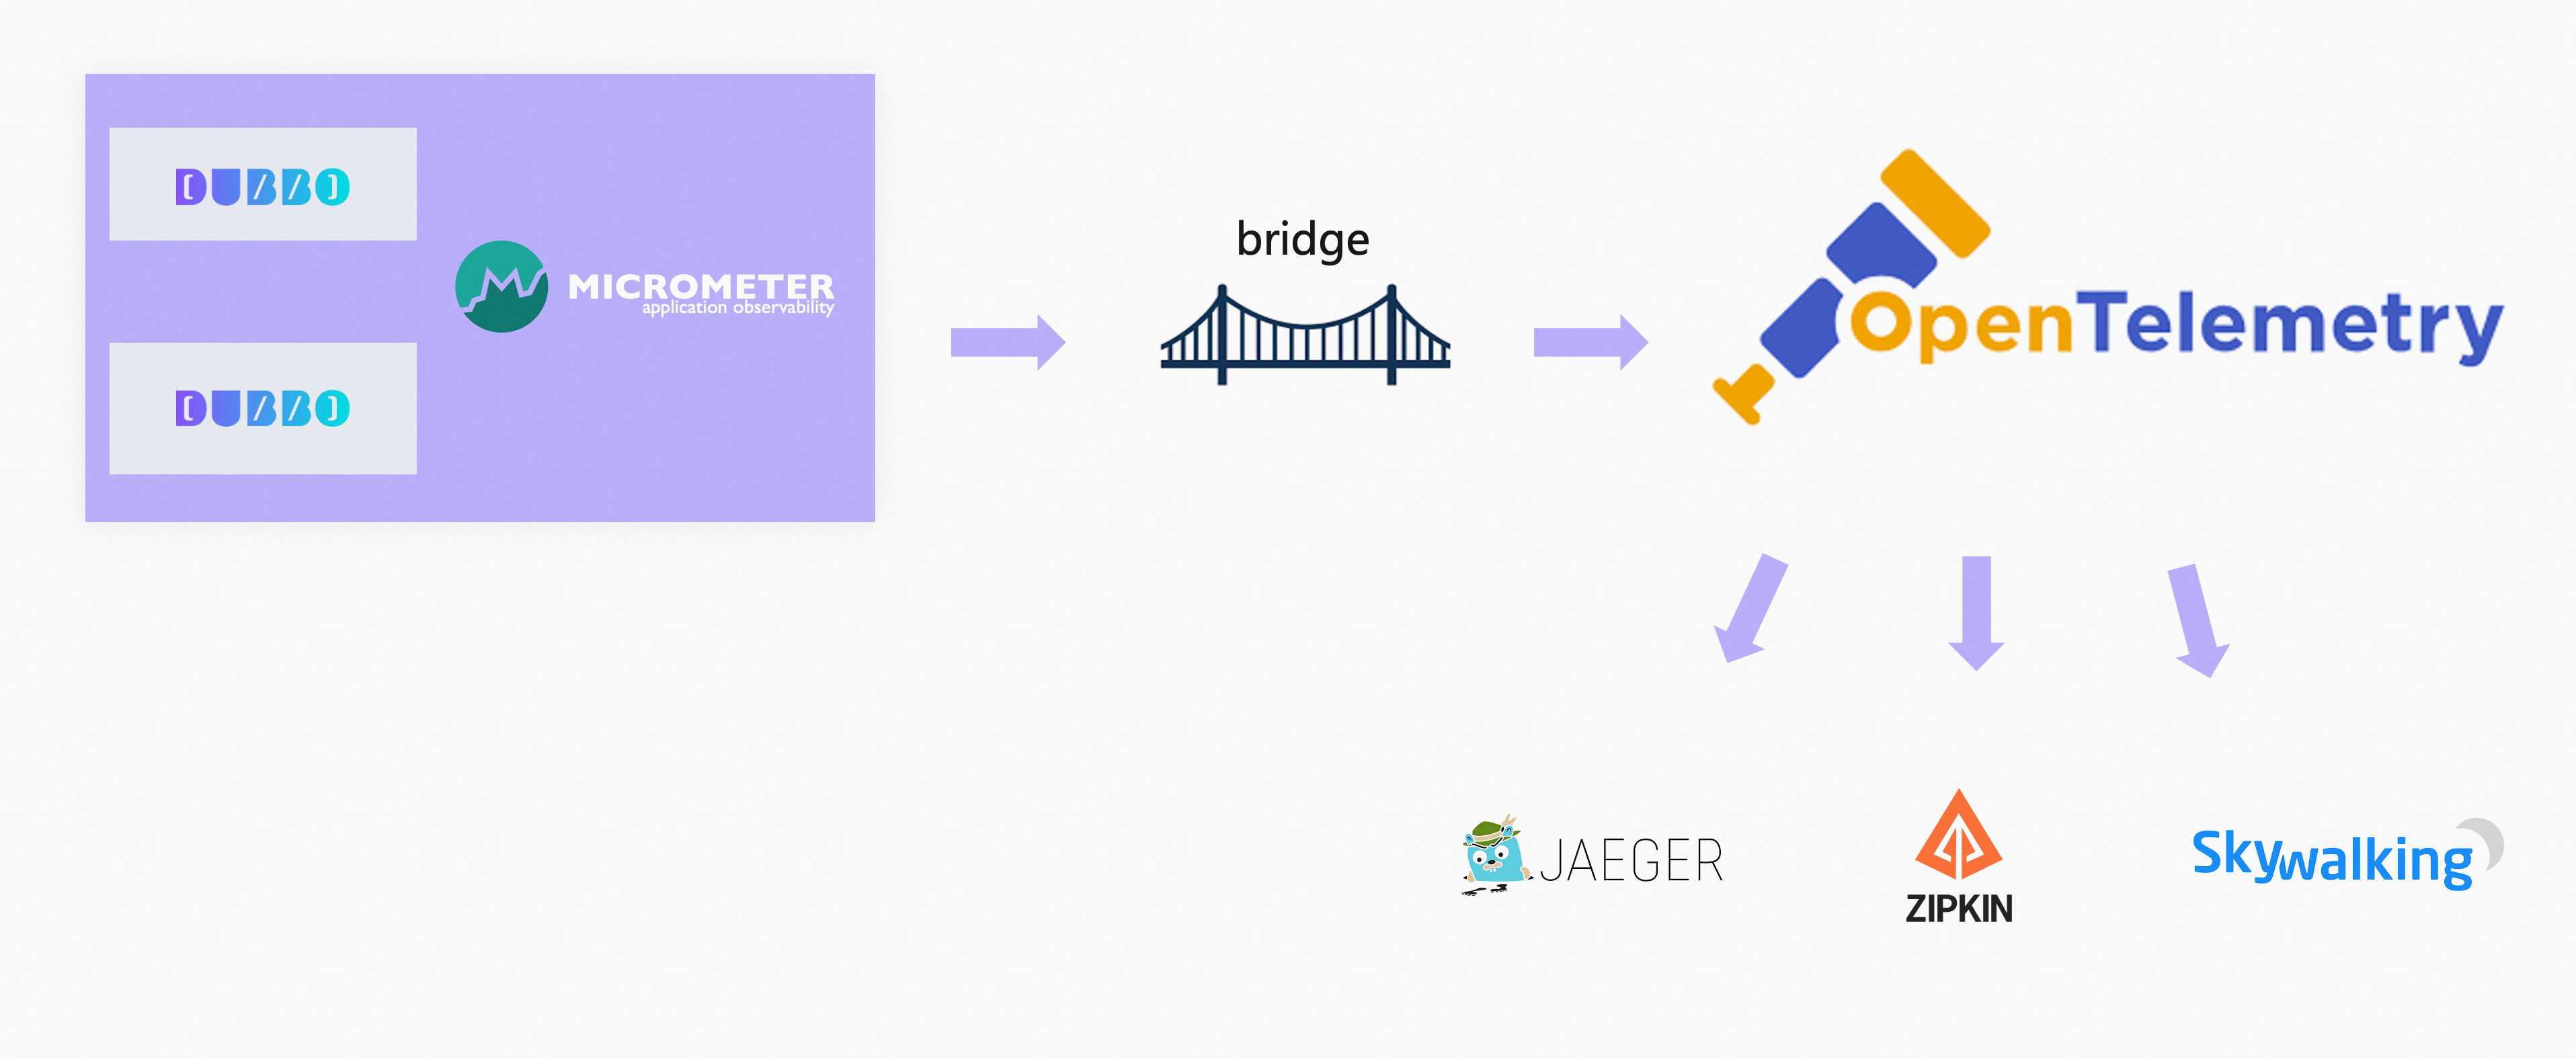
Currently, Dubbo completes all tracing embedding through Micrometer Observation, relying on various Bridge adaptations provided by Micrometer, allowing us to import tracing into various back-end systems. The specific working principle is as follows.
Usage
Using a Dubbo Spring Boot application as an example, you can enable link tracing by adding the following dependency and use the Zipkin exporter bridge to import tracing data into the Zipkin back-end system.
<dependency>
    <groupId>org.apache.dubbo</groupId>
    <artifactId>dubbo-spring-boot-tracing-otel-zipkin-starter</artifactId>
    <version>3.2.1-SNAPSHOT</version>
</dependency>
For more complete examples, please refer to:
- Implementing Dubbo end-to-end tracing with Zipkin
- Implementing Dubbo end-to-end tracing with Skywalking
Associated Logs
Dubbo Tracing also implements automatic association with log systems, automatically including tracing-id, span-id, and other information in the log MDC context. You only need to set the log output format to include something like %X{traceId:-},%X{spanId:-}] to achieve automatic association of business logs with the tracing system. For details, refer to Tracing log context configuration example.
Working Principle
Tracing Related Concepts
Span: The basic unit of work. For example, sending an RPC is a new span, and sending a response to the RPC is also a new span. Spans contain other data such as description, timestamped events, key-value annotations (tags), and the span ID and process ID (usually the IP address) of the spans that caused them. Spans can start and stop and track their timing information. Once a span is created, it must be stopped at some future point.
Trace: A group of spans forming a tree structure. For example, if you run a distributed big data storage system, you might form a trace through a PUT request.
Annotation/Event: Used to record the existence of an event in a timely manner.
Tracing context: For distributed tracing to work, the tracing context (trace identifiers, span identifiers, etc.) must propagate through processes (for example, via threads) and networks.
Log correlation: Parts of the tracing context (e.g., trace identifiers, span identifiers) can be populated into logs of a given application. All logs can then be collected into a single repository and grouped by trace ID. This allows you to obtain all logs for a single business operation (trace) from all services in chronological order.
Latency analysis tools: Tools that collect and visualize exported spans to provide insights into overall tracing. They allow for easy latency analysis.
Tracer: A library that manages the lifecycle of spans (Dubbo currently supports OpenTelemetry and Brave). It can create, start, stop, and report spans to external systems (e.g., Zipkin, Jaeger) through an Exporter.
Exporter: Reports the generated trace information to external systems, such as sending it to Zipkin via HTTP.
SpringBoot Starters
For SpringBoot users, Dubbo provides tracing-related starters that automatically configure Micrometer-related configuration code, allowing users to freely choose a Tracer and Exporter.
OpenTelemetry as Tracer, exporting trace information to Zipkin
  <dependency>
    <groupId>org.apache.dubbo</groupId>
    <artifactId>dubbo-spring-boot-tracing-otel-zipkin-starter</artifactId>
    <version>${version}</version>
  </dependency>
OpenTelemetry as Tracer, exporting trace information to OTLP Collector
  <dependency>
    <groupId>org.apache.dubbo</groupId>
    <artifactId>dubbo-spring-boot-tracing-otel-otlp-starter</artifactId>
    <version>${version}</version>
  </dependency>
Brave as Tracer, exporting trace information to Zipkin
  <dependency>
    <groupId>org.apache.dubbo</groupId>
    <artifactId>dubbo-spring-boot-tracing-brave-zipkin-starter</artifactId>
    <version>${version}</version>
  </dependency>
Freely Assemble Tracer and Exporter
If users have custom requirements based on Micrometer and want to report trace information to other external observation systems, they can refer to the following for freely assembling Tracer and Exporter:
  <!-- Automatic assembly -->
  <dependency>
      <groupId>org.apache.dubbo</groupId>
      <artifactId>dubbo-spring-boot-observability-starter</artifactId>
      <version>${version}</version>
  </dependency>
  <!-- Use otel as tracer -->
  <dependency>
      <groupId>io.micrometer</groupId>
      <artifactId>micrometer-tracing-bridge-otel</artifactId>
      <version>${version}</version>
  </dependency>
  <!-- Export to Zipkin -->
  <dependency>
      <groupId>io.opentelemetry</groupId>
      <artifactId>opentelemetry-exporter-zipkin</artifactId>
      <version>${version}</version>
  </dependency>
  <!-- Automatic assembly -->
  <dependency>
      <groupId>org.apache.dubbo</groupId>
      <artifactId>dubbo-spring-boot-observability-starter</artifactId>
      <version>${version}</version>
  </dependency>
  <!-- Use Brave as tracer -->
  <dependency>
      <groupId>io.micrometer</groupId>
      <artifactId>micrometer-tracing-bridge-brave</artifactId>
      <version>${version}</version>
  </dependency>
  <!-- Export to Zipkin -->
  <dependency>
      <groupId>io.zipkin.reporter2</groupId>
      <artifactId>zipkin-reporter-brave</artifactId>
      <version>${version}</version>
  </dependency>
More starters will be added later, such as Jaeger, SkyWalking, etc.
Dubbo Bootstrap API
For non-SpringBoot projects, the Dubbo API can be used for Tracing.
For detailed cases, refer to code address