Querying Metrics Monitoring Indicators from Prometheus
Prerequisites
This article demonstrates how to deploy Prometheus in a Kubernetes environment and achieve monitoring data statistics and querying for the Dubbo cluster. You need to complete or possess the following:
- A local or remote Kubernetes cluster
- Ensure that Prometheus is correctly installed
- Deploy the sample application and enable metrics collection
- Use the Prometheus dashboard to query data metrics
Ensure Prometheus is Running Correctly
Verify that Prometheus has been correctly deployed
kubectl -n dubbo-system get svc prometheus-server
NAME                TYPE        CLUSTER-IP       EXTERNAL-IP   PORT(S)    AGE
prometheus-server   ClusterIP   10.109.160.254   <none>        9090/TCP   4m
Deploy Sample
kubectl apply -f https://raw.githubusercontent.com/apache/dubbo-samples/master/4-governance/dubbo-samples-metrics-spring-boot/Deployment.yml
Wait for the sample application to run normally, and confirm the application status using the following command:
kubectl -n dubbo-demo get deployments
Query Prometheus
Obtain the Prometheus access address kubectl port-forward service/prometheus-server 9090:9090, open a browser, and visit localhost:9090/graph to access the Prometheus console.
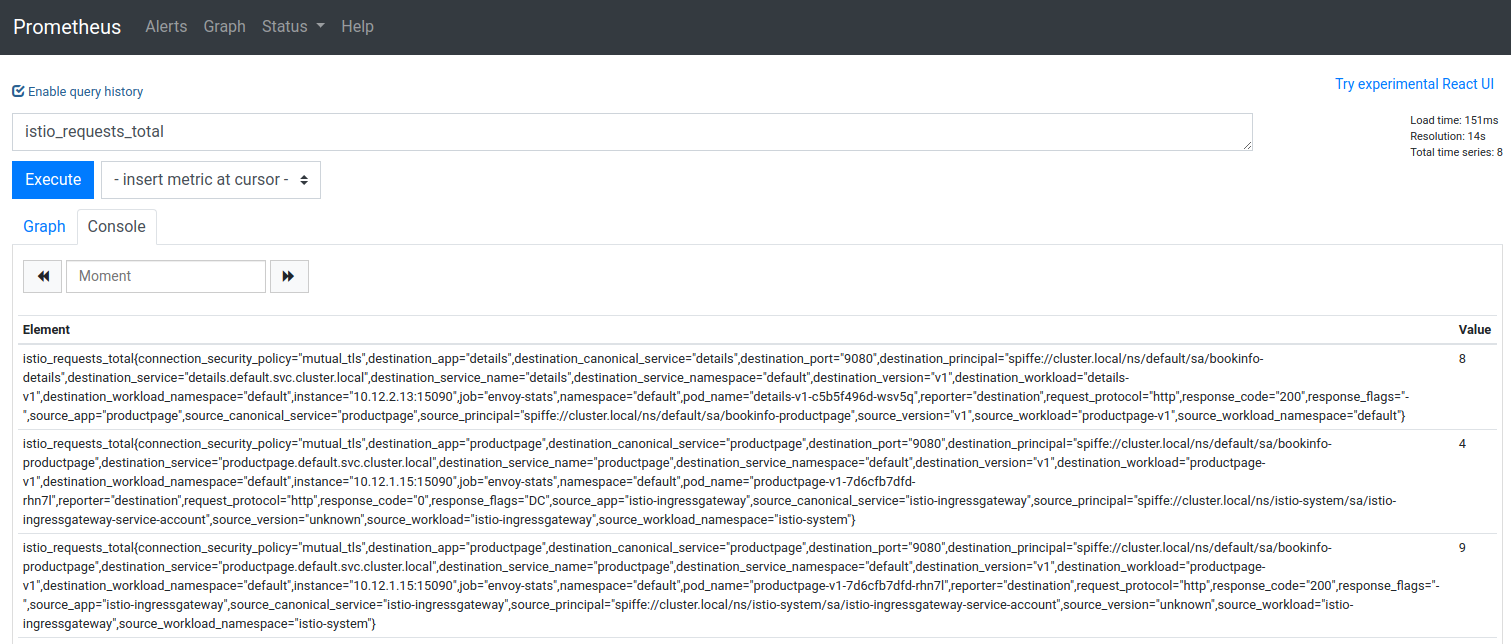
Next, execute the Prometheus query command. You can confirm the Metrics supported by Dubbo here.
1. In the “Expression” overview, enter dubbo_consumer_qps_total, and the following results will return