OTlp
This example demonstrates how to use OpenTelemetry as a Tracer in a Dubbo project to report Trace information to the Otlp Collector, which then forwards it to Zipkin and Jagger.
Overview
This example demonstrates how to use OpenTelemetry as a Tracer in a Dubbo project to report Trace information to the Otlp Collector, which then forwards it to Zipkin and Jagger. Code repository
It consists of three parts:
- dubbo-samples-spring-boot-tracing-otel-oltp-interface
- dubbo-samples-spring-boot-tracing-otel-oltp-provider
- dubbo-samples-spring-boot-tracing-otel-oltp-consumer
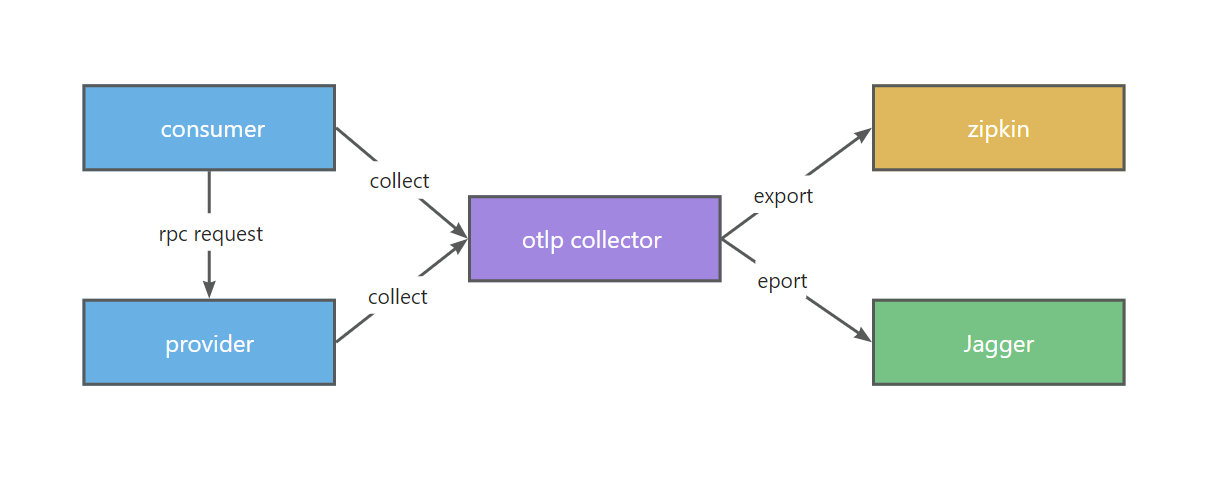
Case Architecture Diagram
Quick Start
Install & Start Otlp Collector
Follow the OpenTelemetry Collector Quick Start to start the otlp collector.
Start Provider
Run org.apache.dubbo.springboot.demo.provider.ProviderApplication directly from the IDE.
Start Consumer
Start org.apache.dubbo.springboot.demo.consumer.ConsumerApplication directly from the IDE.
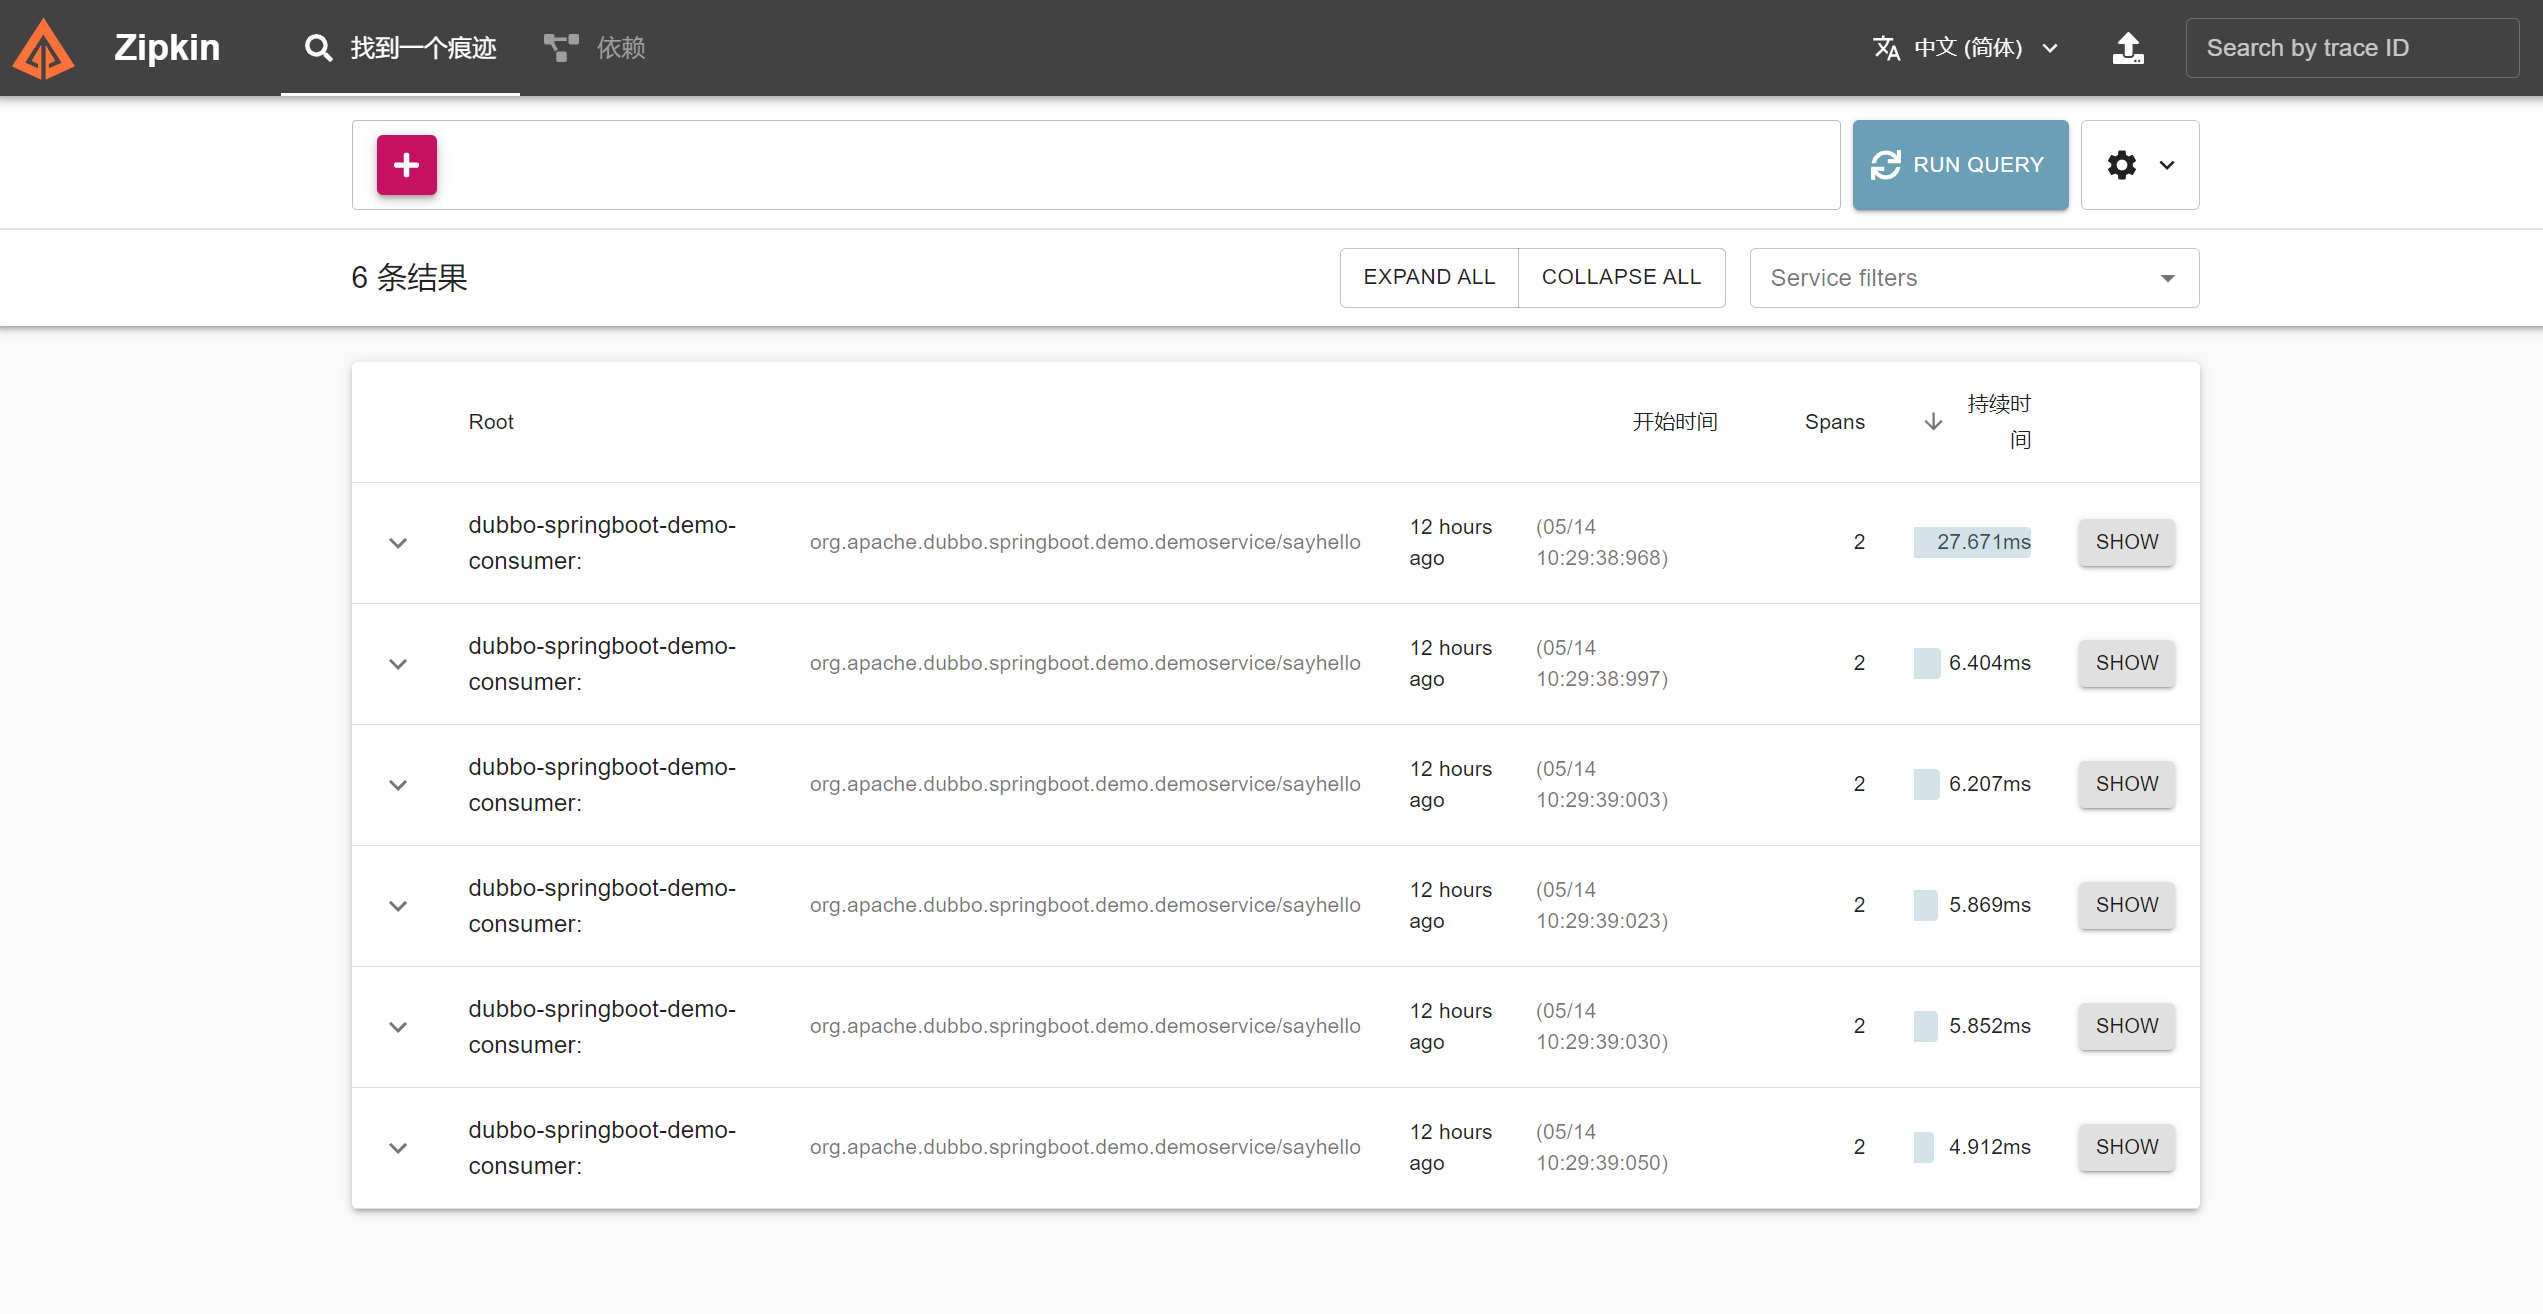
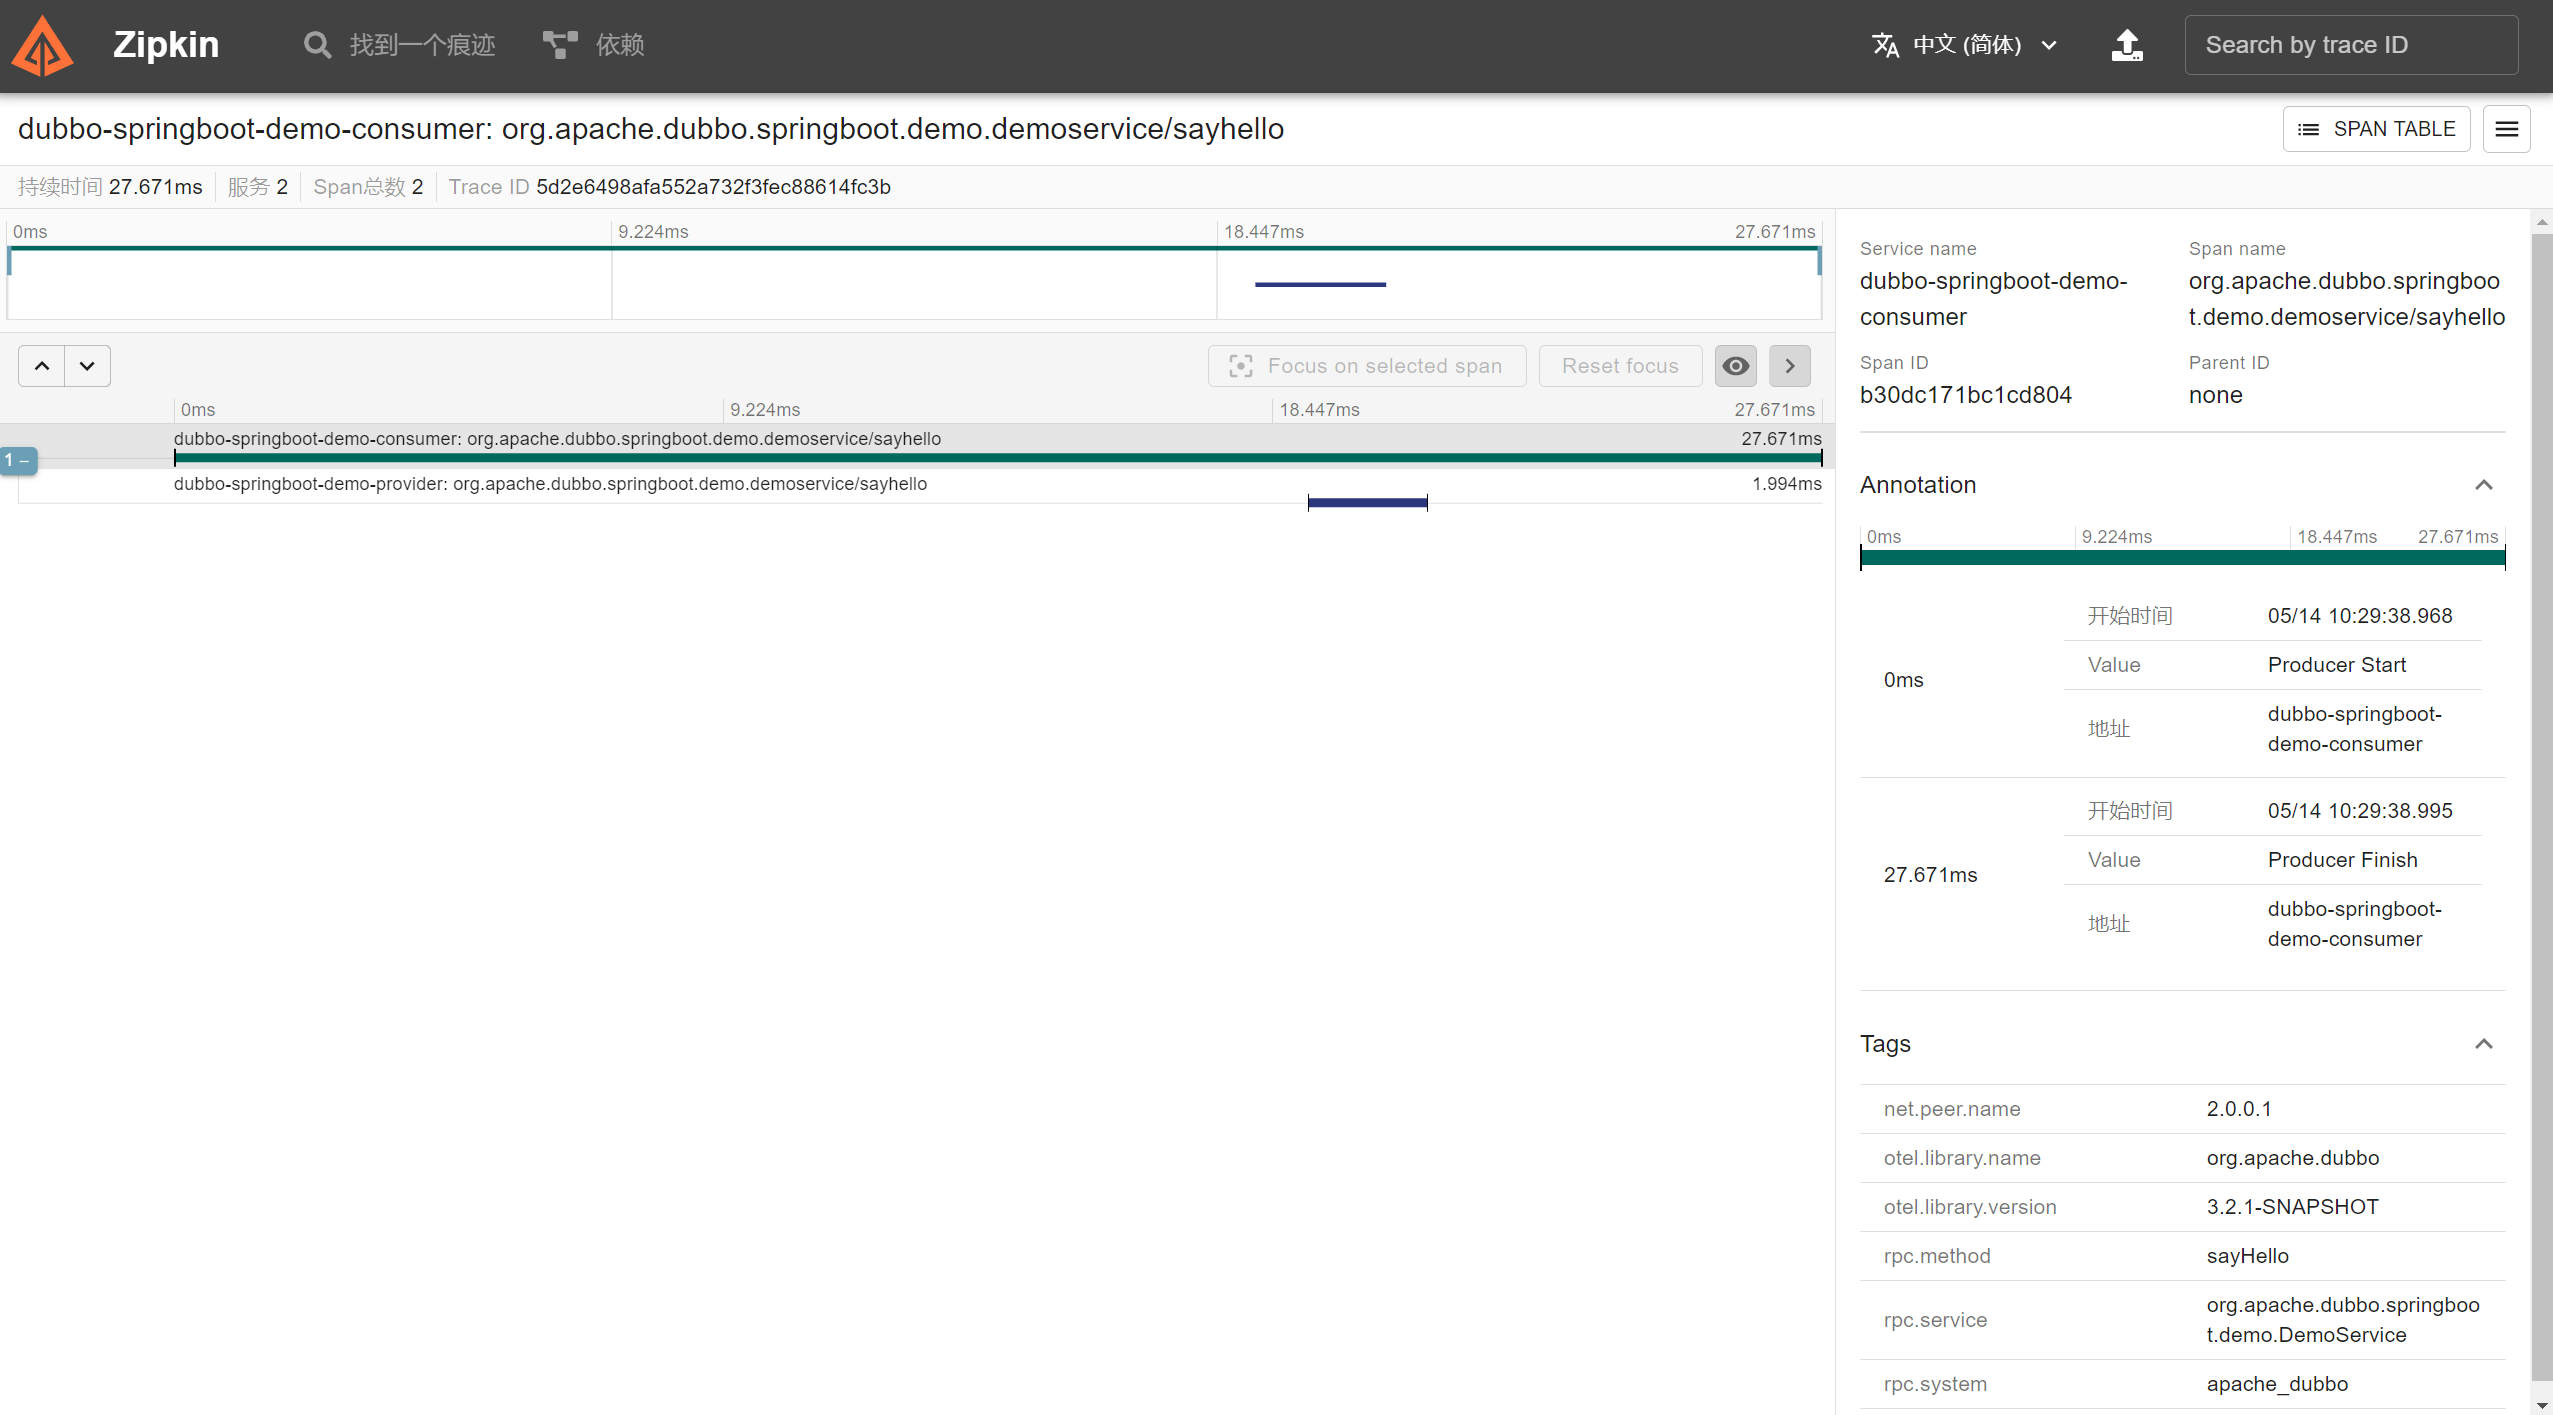
View Trace Information
Open the Zipkin dashboard in the browser at http://localhost:9411/zipkin/:
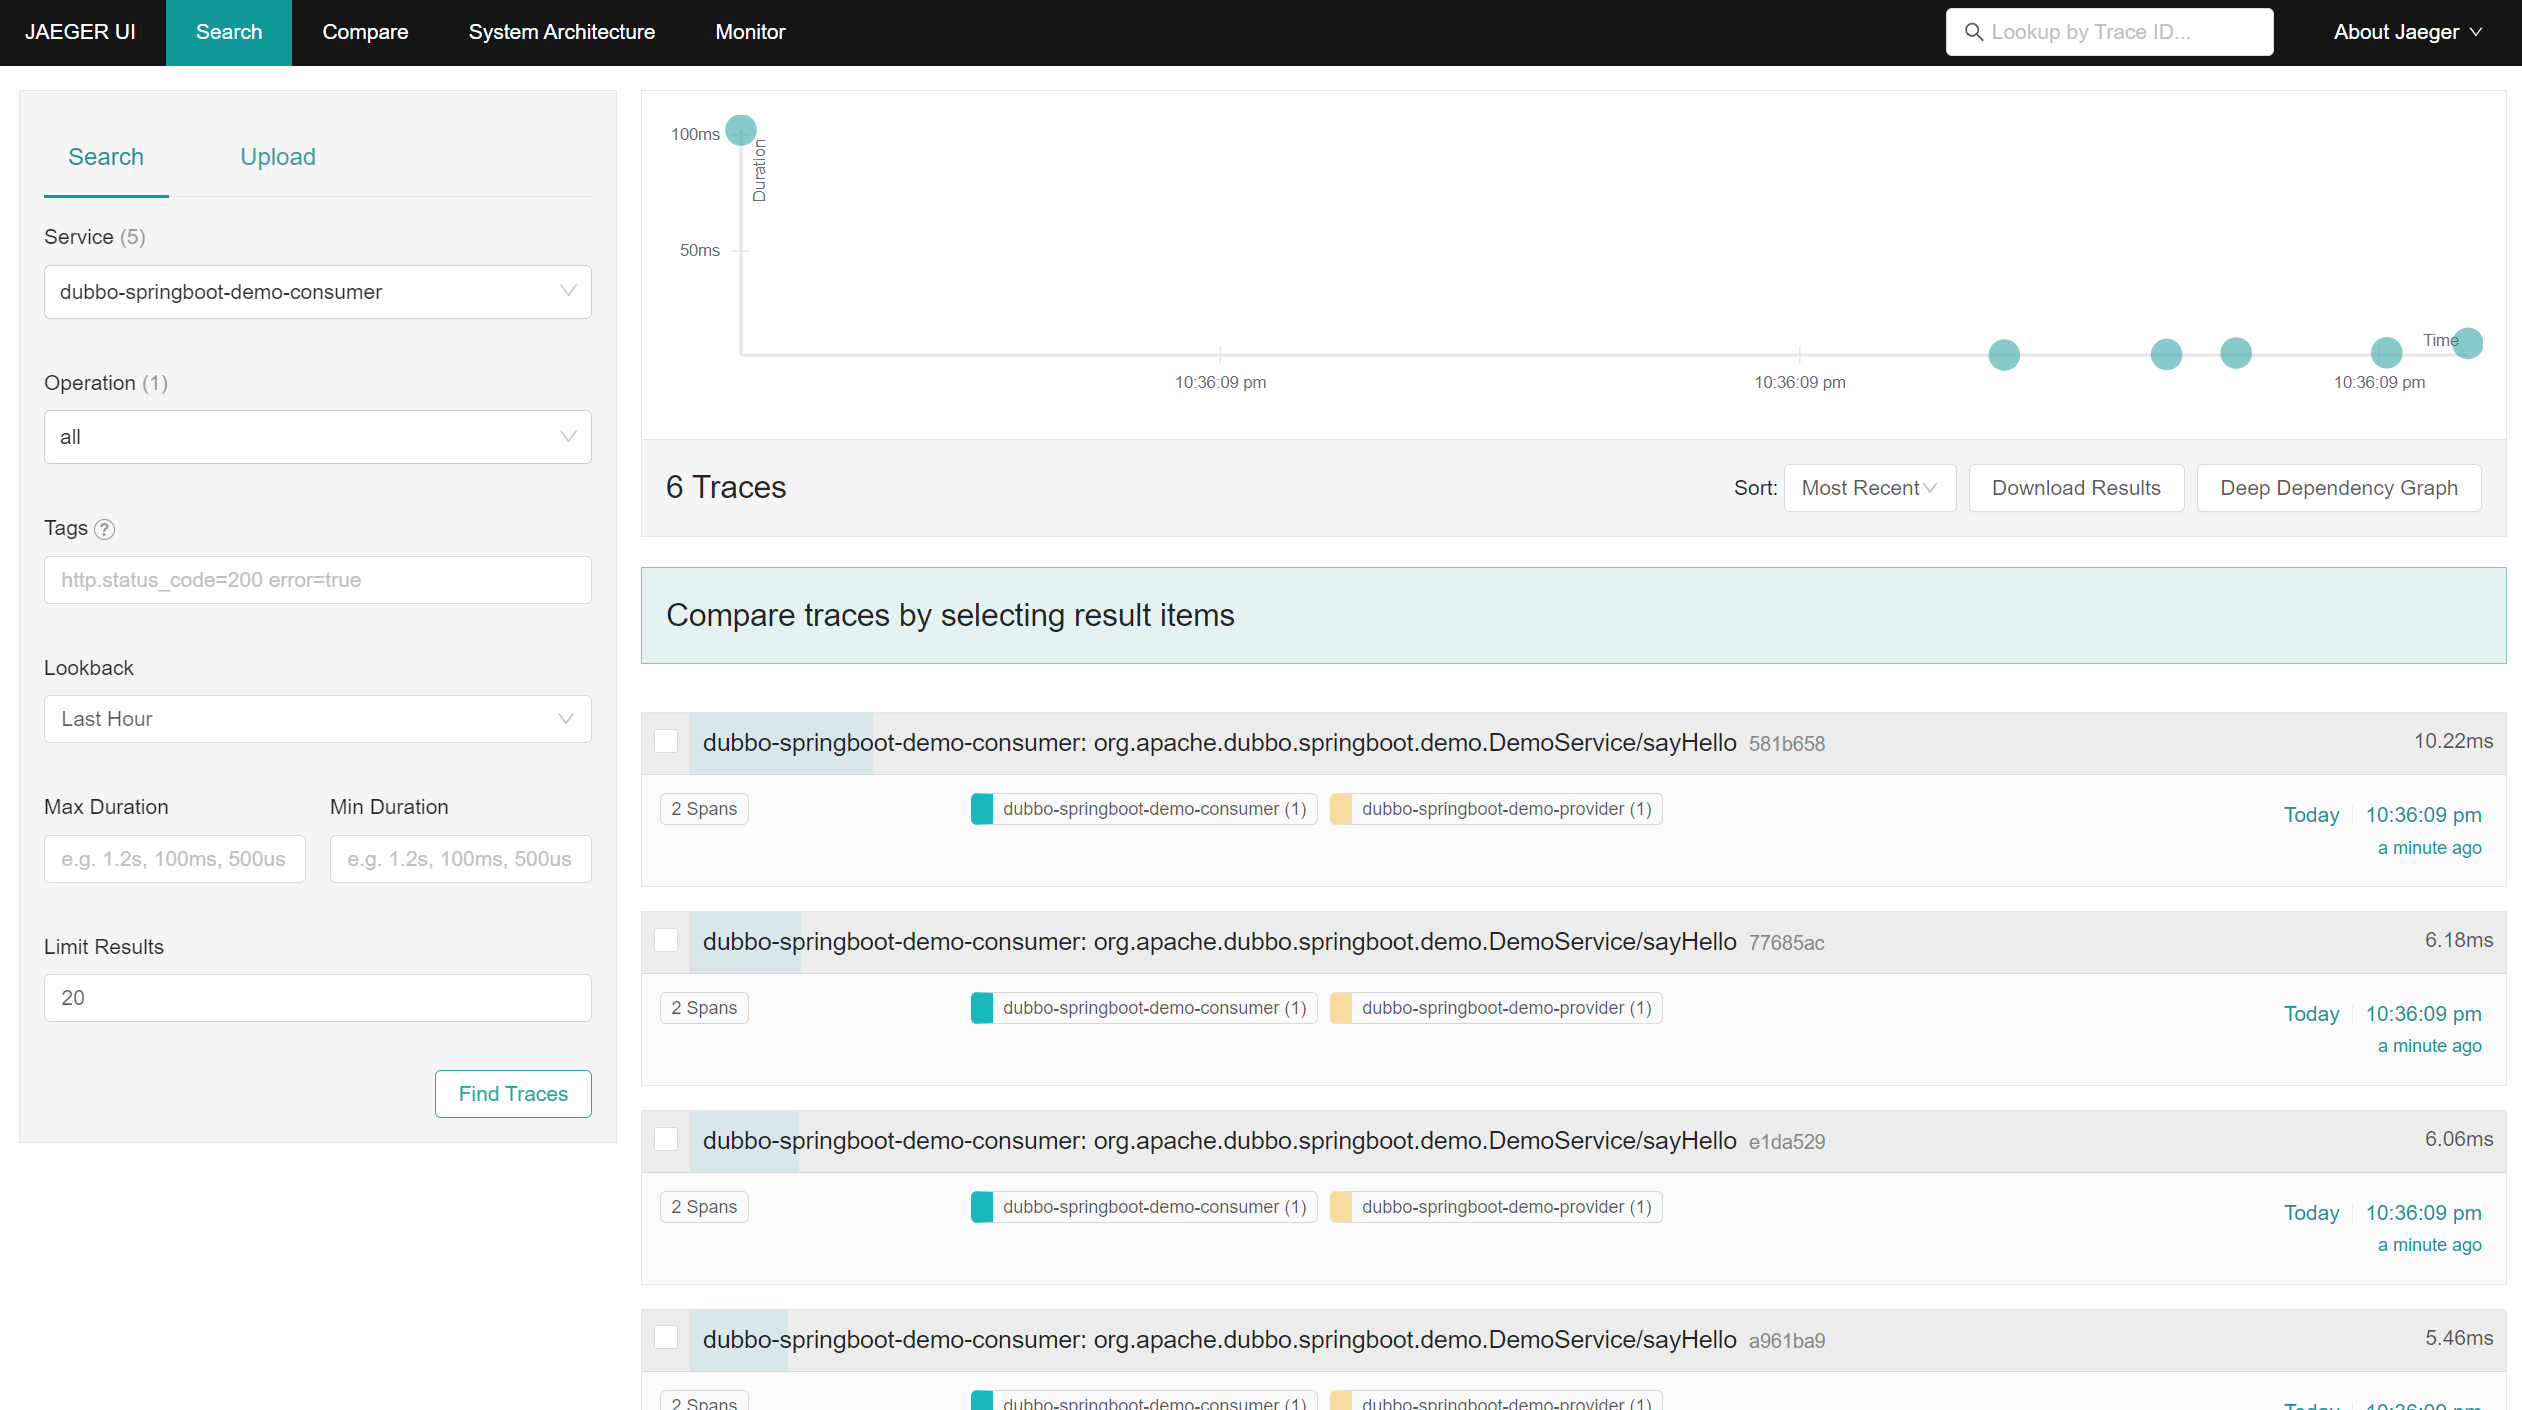
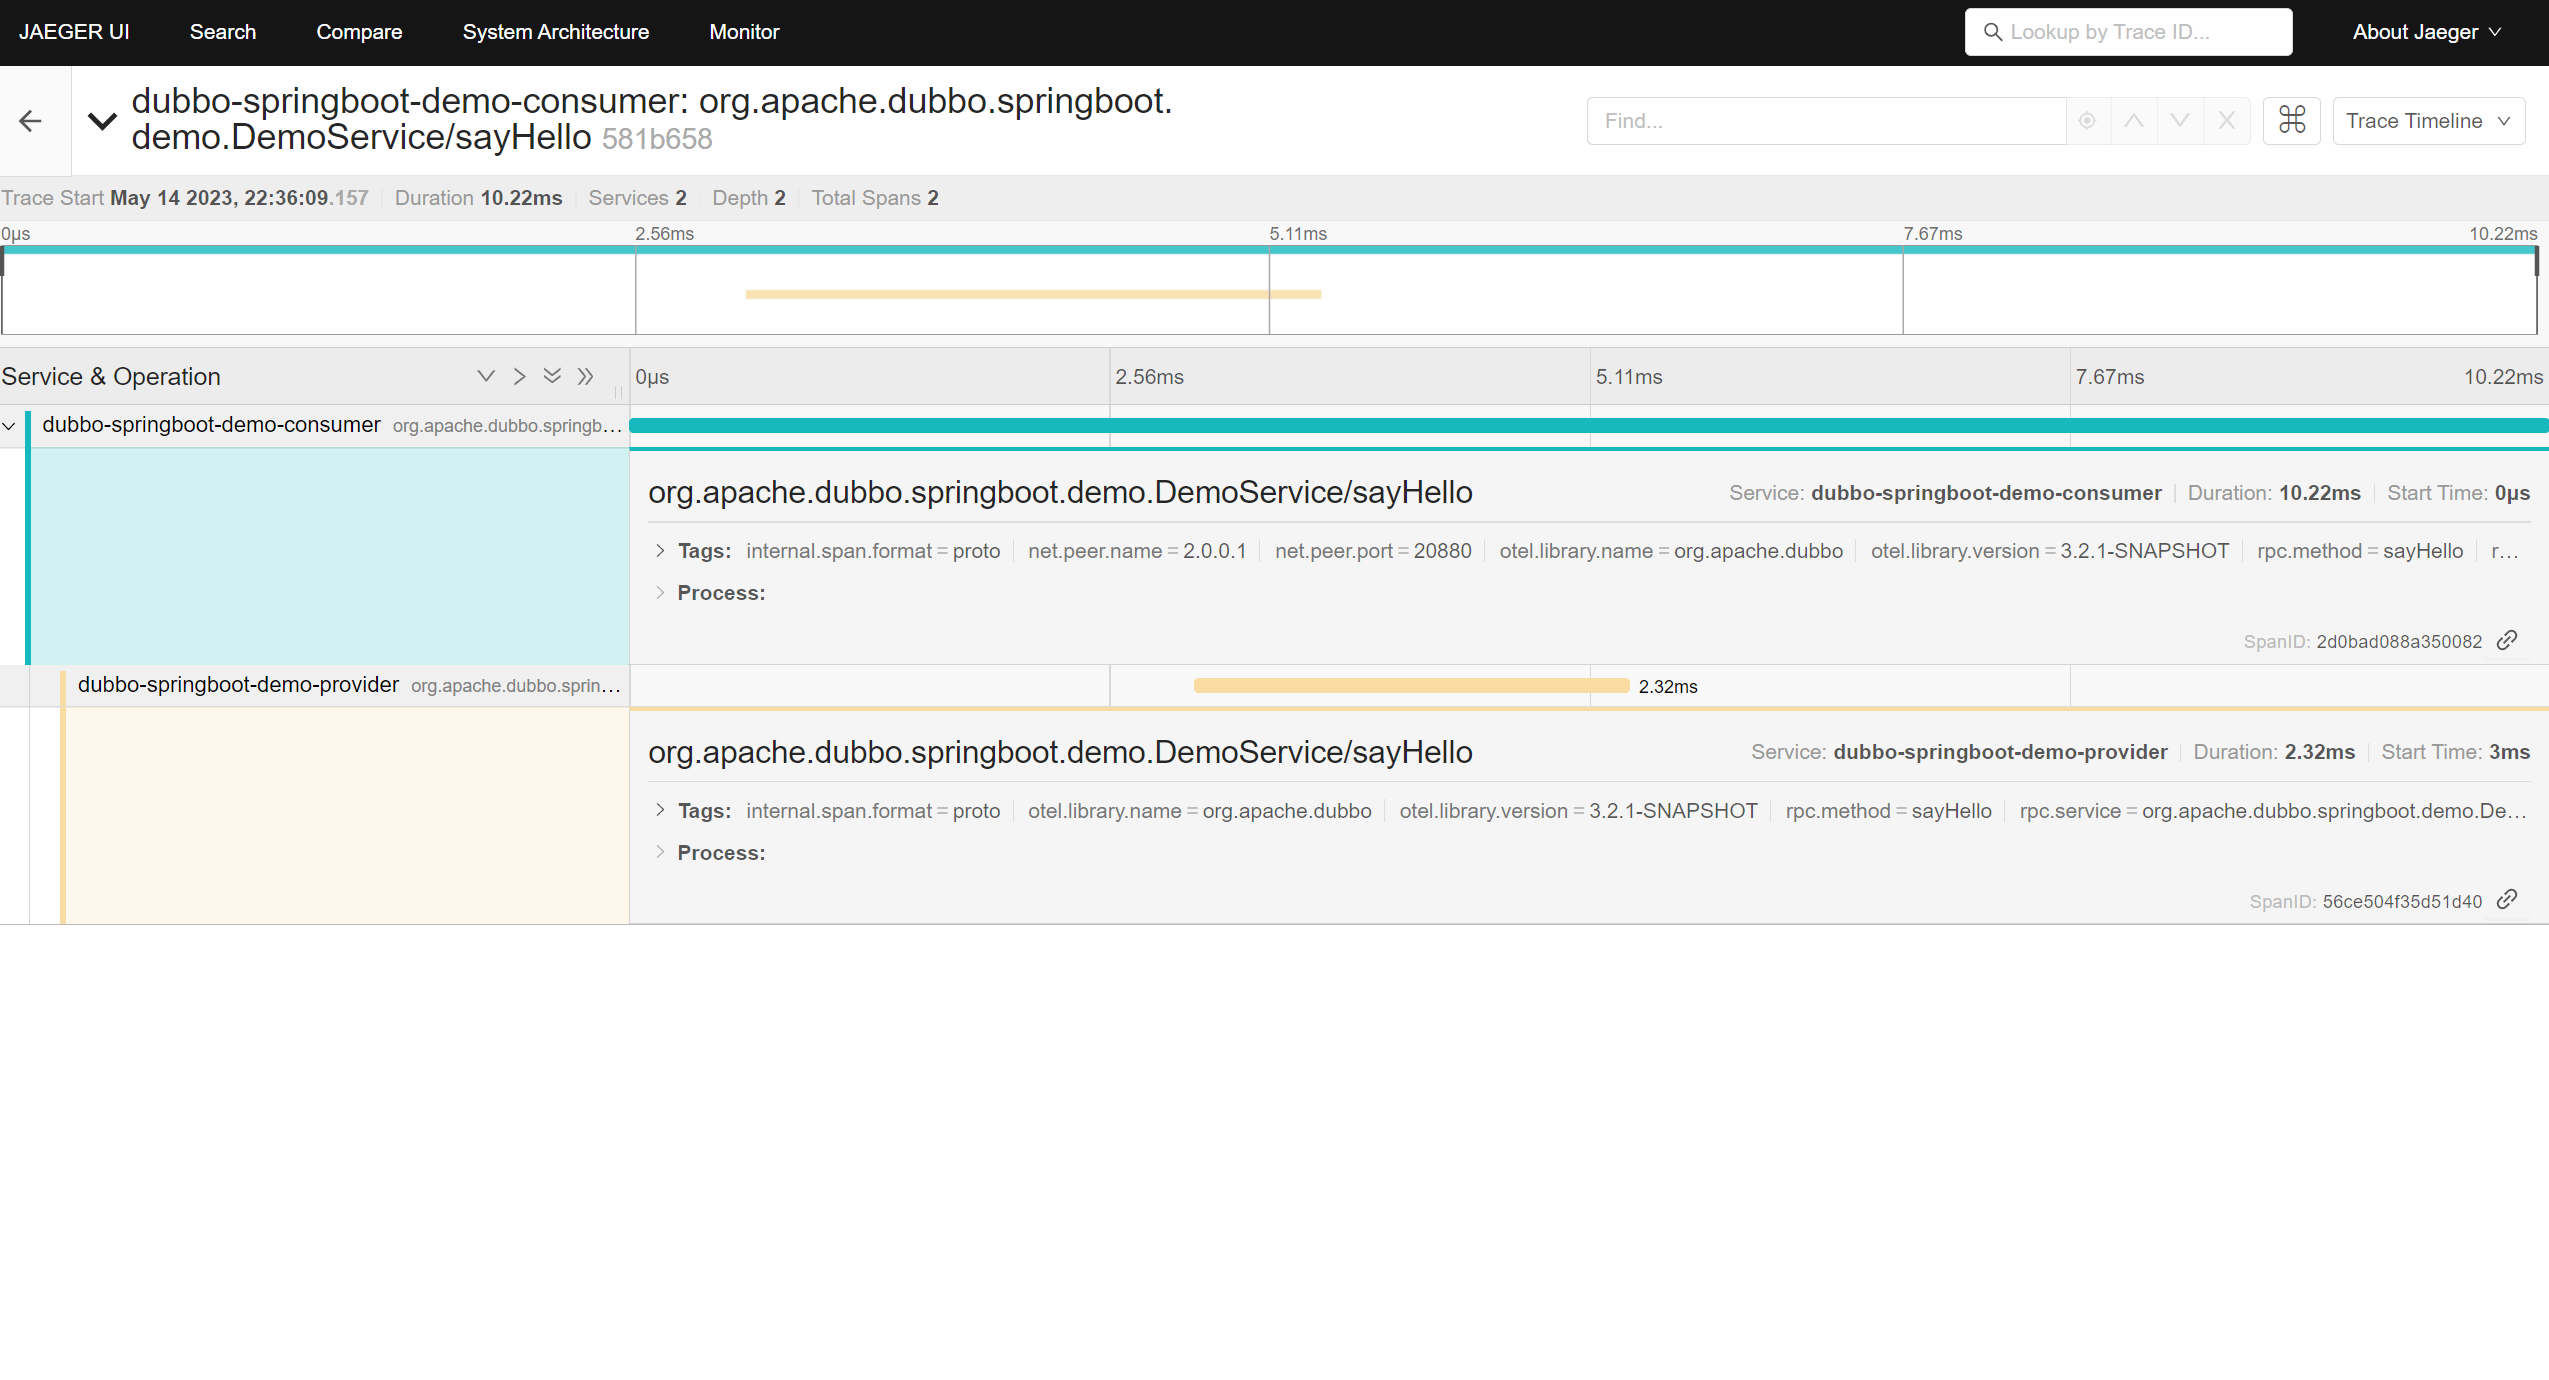
Open the Jaeger dashboard in the browser at http://localhost:16686/search:
How to Use in a SpringBoot Project
1. Add Dependencies in Your Project
For SpringBoot projects, you can use dubbo-spring-boot-tracing-otel-otlp-starter:
<!-- OpenTelemetry as Tracer, Otlp as exporter -->
<dependency>
    <groupId>org.apache.dubbo</groupId>
    <artifactId>dubbo-spring-boot-tracing-otel-otlp-starter</artifactId>
</dependency>
2. Configuration
application.yml
dubbo:
  tracing:
    enabled: true # default is false
    sampling:
      probability: 0.5 # sampling rate, default is 0.1
    propagation:
      type: W3C # W3C/B3 default is W3C
    tracing-exporter:
      otlp-config:
        endpoint: http://localhost:4317
        timeout: 10s # default is 10s
        compression-method: none # none/gzip The method used to compress payloads, default is "none"
        headers: # customized added headers, default is empty
          auth: admin

# tracing info output to logging
logging:
  level:
    root: info
  pattern:
    console: '[%d{dd/MM/yy HH:mm:ss:SSS z}] %t %5p %c{2} [%X{traceId:-}, %X{spanId:-}]: %m%n'
How to Use Based on Dubbo API
1. Add Dependencies in Your Project
    <!-- Required, core dependency of dubbo-tracing -->
    <dependency>
        <groupId>org.apache.dubbo</groupId>
        <artifactId>dubbo-tracing</artifactId>
    </dependency>
    <!-- Opentelemetry as Tracer -->
    <dependency>
        <groupId>io.micrometer</groupId>
        <artifactId>micrometer-tracing-bridge-otel</artifactId>
    </dependency>
    <!-- OTlp as exporter -->
    <dependency>
        <groupId>io.opentelemetry</groupId>
        <artifactId>opentelemetry-exporter-otlp</artifactId>
    </dependency>
2. Configuration
TracingConfig tracingConfig = new TracingConfig();
// Enable dubbo tracing
tracingConfig.setEnabled(true);
// Set sampling rate
tracingConfig.setSampling(new SamplingConfig(1.0f));
// Set Propagation, default is W3C, optional W3C/B3
tracingConfig.setPropagation(new PropagationConfig("W3C"));
// Set trace reporting
ExporterConfig exporterConfig = new ExporterConfig();
// Set to report trace to Zipkin
exporterConfig.setZipkin(new ExporterConfig.OtlpConfig("http://localhost:4317", Duration.ofSeconds(10), "none"));
tracingConfig.setExporter(exporterConfig);