Attention: The feature described in this doc is still under development or is in a very early stage, please keep updated!
Admin Overall Architecture and Installation Steps
Reviewing the overall architecture of the Dubbo service governance system, Admin is a core component in the service governance control plane, responsible for service governance and visualization display for microservice clusters.
Admin Deployment Architecture
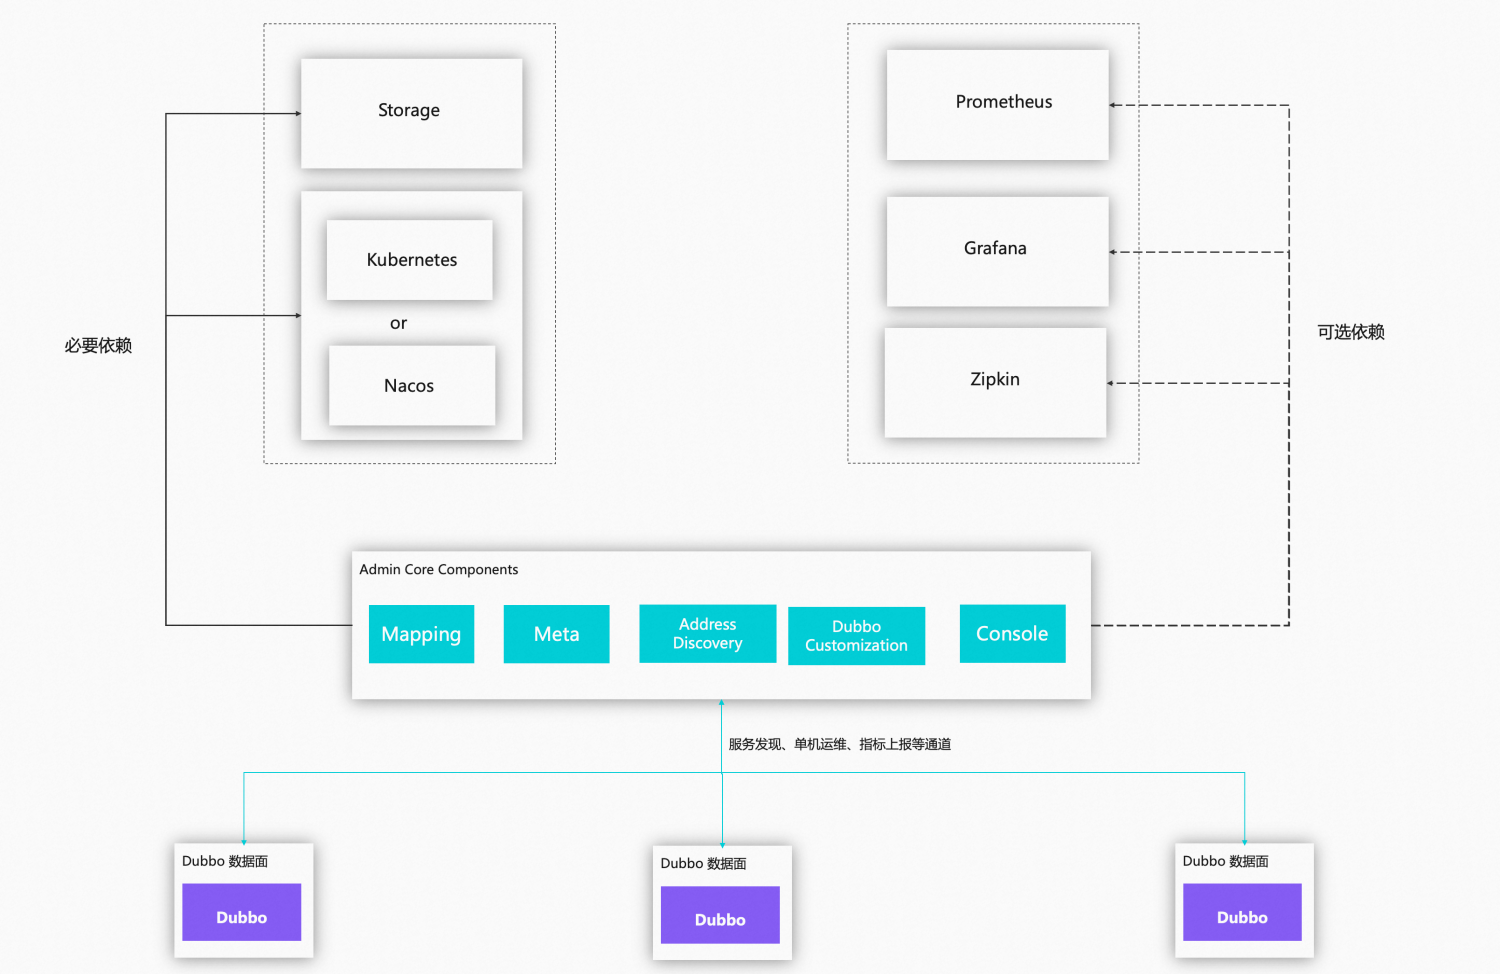
Overall, the Admin deployment architecture is divided into the following parts:
- The Admin main process, including service discovery metadata management, a visualization console, security authentication policy control, and other customized service governance capabilities.
- Strong dependency components, including Mysql database, registration/configuration/metadata centers (which can be Kubernetes, Nacos, Zookeeper, etc.)
- Optional dependency components, including Prometheus, Grafana, Zipkin, etc.
Install Admin
Dubboctl Installation
Download
Currently, Dubboctl is not formally released and can be tried as follows. Pull Dubbo Admin and compile Dubboctl
git clone https://github.com/apache/dubbo-admin.git
cd dubbo-admin/cmd/dubboctl
go build -o dubboctl .
Place dubboctl in an executable path
ln -s dubbo-admin/cmd/dubboctl/dubboctl /usr/local/bin/dubboctl
Install
The installation process will sequentially:
- Overlay the user-defined configuration profile and setting parameters onto the default profile to obtain the final profile
# default profile
apiVersion: dubbo.apache.org/v1alpha1
kind: DubboOperator
metadata:
  namespace: dubbo-system
spec:
  profile: default
  namespace: dubbo-system
  componentsMeta:
    admin:
      enabled: true
    grafana:
      enabled: true
      repoURL: https://grafana.github.io/helm-charts
      version: 6.52.4
    nacos:
      enabled: true
    zookeeper:
      enabled: true
      repoURL: https://charts.bitnami.com/bitnami
      version: 11.1.6
    prometheus:
      enabled: true
      repoURL: https://prometheus-community.github.io/helm-charts
      version: 20.0.2
    skywalking:
      enabled: true
      repoURL: https://apache.jfrog.io/artifactory/skywalking-helm
      version: 4.3.0
    zipkin:
      enabled: true
      repoURL: https://openzipkin.github.io/zipkin
      version: 0.3.0
It is recommended to use a custom profile for configuration, enabling or disabling components in componentsMeta and configuring each component under components. The configuration values of each component are the values of helm charts. For specific component configurations, please refer to: Grafana: https://github.com/grafana/helm-charts/blob/main/charts/grafana/README.md Zookeeper: https://github.com/bitnami/charts/tree/main/bitnami/zookeeper/#installing-the-chart Prometheus: https://github.com/prometheus-community/helm-charts/tree/main/charts Skywalking: https://github.com/apache/skywalking-kubernetes/blob/master/chart/skywalking/README.md Zipkin: https://github.com/openzipkin/zipkin-helm
# customization profile
apiVersion: dubbo.apache.org/v1alpha1
kind: DubboOperator
metadata:
  namespace: dubbo-system
spec:
  profile: default
  namespace: dubbo-system
  componentsMeta:
    admin:
      enabled: true
    grafana:
      enabled: true
      version: 6.31.0
    prometheus:
      enabled: false
  components:
    admin:
      replicas: 3
    grafana:
      testFramework:
        enabled: false
- Pull the required components based on the profile and generate the manifest. Currently, Admin and Nacos are local, no need to pull; Grafana, Zookeeper, Prometheus, Skywalking, Zipkin will pull from the official chart repository, specific addresses and versions can be seen in the above default profile
- Apply the manifest to the k8s cluster
dubboctl manifest install # Install using default manifests

# or

dubboctl manifest generate | kubectl apply -f -
dubboctl install --set spec.components.admin.replicas=2 # Set component configuration
dubboctl install --set spec.componentsMeta.admin.enabled=true, spec.componentsMeta.grafana.enabled=false
# Enable or disable components
dubboctl install --set spec.componentsMeta.grafana.repoURL=https://grafana.github.io/helm-charts, spec.componentsMeta.grafana.version=6.31.0
# Set repository address and version for remotely pulled components
Check installation effect
kubectl get pod -n dubbo-system
Open Admin Console
kubectl port-forward svc/dubbo-admin -n dubbo-system 38080:38080
Open the browser and visit: http://127.0.0.1:38080/
Helm Installation
Get the charts
helm repo add https://charts.bitnami.com/bitnami
helm repo add https://prometheus-community.github.io/helm-charts
helm repo add https://grafana.github.io/helm-charts
helm repo add https://apache.jfrog.io/artifactory/skywalking-helm
helm repo add https://openzipkin.github.io/zipkin
Install zookeeper
helm install zookeeper bitnami/zookeeper -n dubbo-system
Install prometheus
helm install prometheus prometheus-community/prometheus -n dubbo-system
Install grafana
helm install grafana grafana/grafana -n dubbo-system
Install skywalking
helm install skywalking skywalking/skywalking -n dubbo-system
Install zipkin
helm install zipkin openzipkin/zipkin -n dubbo-system
Check installation status
helm ls -n dubbo-system ; kubectl get pods -n dubbo-system --output wide
VM Installation
Download
Download the Dubbo Admin release version
curl -L https://dubbo.apache.org/installer.sh | VERSION=0.1.0 sh -
# Admin needs to organize the release version
Place dubboctl in an executable path
ln -s dubbo-admin-0.1.0/bin/dubbo-admin /usr/local/bin/dubbo-admin
Run
dubbo-admin run -f override-configuration.yml
Configuration Manual (Configuration)
Configuration used to control the behavior of dubbo-admin
# Environment type. Available values are: "kubernetes" or "universal"
environment: universal # ENV: DUBBO_ENVIRONMENT
# Mode in which Dubbo CP is running. Available values are: "standalone", "global", "zone"
mode: standalone # ENV: DUBBO_MODE

# Resource Store configuration
store:
  # Type of Store used in the Control Plane. Available values are: "kubernetes", "postgres" or "memory"
  type: memory # ENV: DUBBO_STORE_TYPE

  # Kubernetes Store configuration (used when store.type=kubernetes)
  kubernetes:
    # Namespace where Control Plane is installed to.
    systemNamespace: dubbo-system # ENV: DUBBO_STORE_KUBERNETES_SYSTEM_NAMESPACE

  # Postgres Store configuration (used when store.type=postgres)
  mysql:
    # Host of the Postgres DB
    host: 127.0.0.1 # ENV: DUBBO_STORE_POSTGRES_HOST
    # Port of the Postgres DB
    port: 15432 # ENV: DUBBO_STORE_POSTGRES_PORT
    # User of the Postgres DB
    user: dubbo # ENV: DUBBO_STORE_POSTGRES_USER
    # Password of the Postgres DB
    password: dubbo # ENV: DUBBO_STORE_POSTGRES_PASSWORD
    # Database name of the Postgres DB
    dbName: dubbo # ENV: DUBBO_STORE_POSTGRES_DB_NAME
    # Connection Timeout to the DB in seconds
    connectionTimeout: 5 # ENV: DUBBO_STORE_POSTGRES_CONNECTION_TIMEOUT
    # Maximum number of open connections to the database
    # `0` value means number of open connections is unlimited
    maxOpenConnections: 50 # ENV: DUBBO_STORE_POSTGRES_MAX_OPEN_CONNECTIONS
    # Maximum number of connections in the idle connection pool
    # <0 value means no idle connections and 0 means default max idle connections
    maxIdleConnections: 50  # ENV: DUBBO_STORE_POSTGRES_MAX_IDLE_CONNECTIONS
    # TLS settings
    tls:
      # Mode of TLS connection. Available values are: "disable", "verifyNone", "verifyCa", "verifyFull"
      mode: disable # ENV: DUBBO_STORE_POSTGRES_TLS_MODE
      # Path to TLS Certificate of the client. Used in verifyCa and verifyFull modes
      certPath: # ENV: DUBBO_STORE_POSTGRES_TLS_CERT_PATH
      # Path to TLS Key of the client. Used in verifyCa and verifyFull modes
      keyPath: # ENV: DUBBO_STORE_POSTGRES_TLS_KEY_PATH
      # Path to the root certificate. Used in verifyCa and verifyFull modes.
      caPath: # ENV: DUBBO_STORE_POSTGRES_TLS_ROOT_CERT_PATH
    # MinReconnectInterval controls the duration to wait before trying to
    # re-establish the database connection after connection loss. After each
    # consecutive failure this interval is doubled, until MaxReconnectInterval
    # is reached. Successfully completing the connection establishment procedure
    # resets the interval back to MinReconnectInterval.
    minReconnectInterval: "10s" # ENV: DUBBO_STORE_POSTGRES_MIN_RECONNECT_INTERVAL
    # MaxReconnectInterval controls the maximum possible duration to wait before trying
    # to re-establish the database connection after connection loss.
    maxReconnectInterval: "60s" # ENV: DUBBO_STORE_POSTGRES_MAX_RECONNECT_INTERVAL
server:
	port: 38080
registry:
  address: xxx
metadata-center:
  address: xxx
config-center:
	address: xxx
external-services:
  prometheus:
      # Prometheus service name is "metrics" and is in the "telemetry" namespace
		  # http://prometheus.<dubbo_namespace_name>:9090
      url: "http://metrics.telemetry:9090/"
  tracing:
    # Enabled by default. Kiali will anyway fallback to disabled if
    # Jaeger is unreachable.
    enabled: true
    # Jaeger service name is "tracing" and is in the "telemetry" namespace.
    # Make sure the URL you provide corresponds to the non-GRPC enabled endpoint
    # if you set "use_grpc" to false.
    in_cluster_url: 'http://tracing.telemetry:16685/jaeger'
    use_grpc: true
    # Public facing URL of Jaeger
    url: 'http://my-jaeger-host/jaeger'
	grafana:
      enabled: true
      # Grafana service name is "grafana" and is in the "telemetry" namespace.
      in_cluster_url: 'http://grafana.telemetry:3000/'
      # Public facing URL of Grafana
      url: 'http://my-ingress-host/grafana'

# More configurations
Open Admin Console
Open the browser and visit: http://127.0.0.1:38080/